From investor to scalper is an analysis cycle in which we take one financial instrument each day and the analysis includes a detailed look at the value from the monthly/weekly chart to the H1/M15.
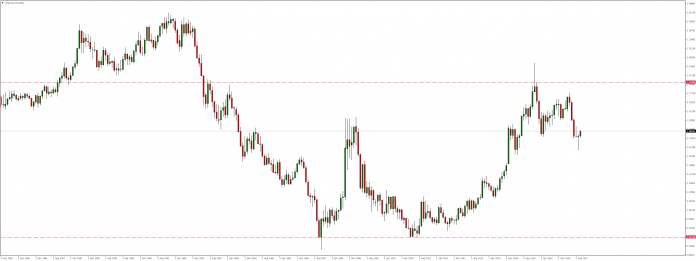
As a result of the bullish trend in May 2011, the market reached level of 1.4100 converging precisely with 70.7% of the Fibonacci correction from previous declines, where in January last year there was a supply reaction. For three consecutive months we have seen very dynamic declines. During next year we have seen again growth, although it was definitely less dynamic and finally, from May this year we again observe the advantage of supply.
Looking at the weekly chart, we note that the whole, lasting since May upward movement was within the channel from which we broke down in June. Although the later declines did not reach precisely 1.2000, the support response has already emerged in September.

From then we are seeing a rebound and if this trend continues, soon we may be able to test again level 1.2760.
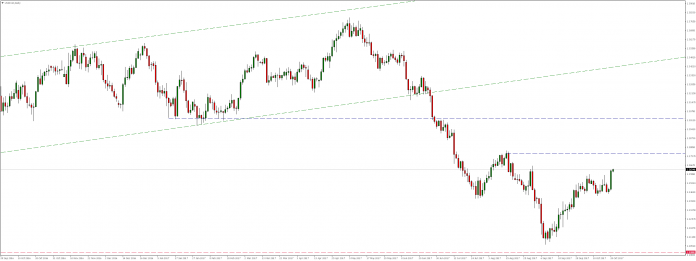
For this to occur, we would have to overcome the local resistance in the area we are currently in.
Error, group does not exist! Check your syntax! (ID: 4)
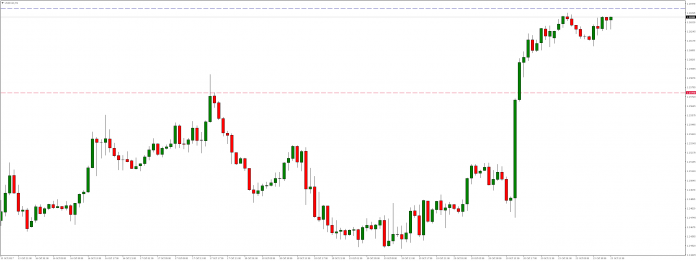
However, given the range of Friday’s upswings, it may not be possible for this to happen until we have some bearish correction. Potential range for such drops could be around 1.2575.


 Review")


