![]()
![]() From Investor to Scalper – series of studies created in cooperation with broker BDSwiss, in which we take a financial instrument and the analysis includes a detailed look at the value from the monthly chart and ending with H4/H1.
From Investor to Scalper – series of studies created in cooperation with broker BDSwiss, in which we take a financial instrument and the analysis includes a detailed look at the value from the monthly chart and ending with H4/H1.
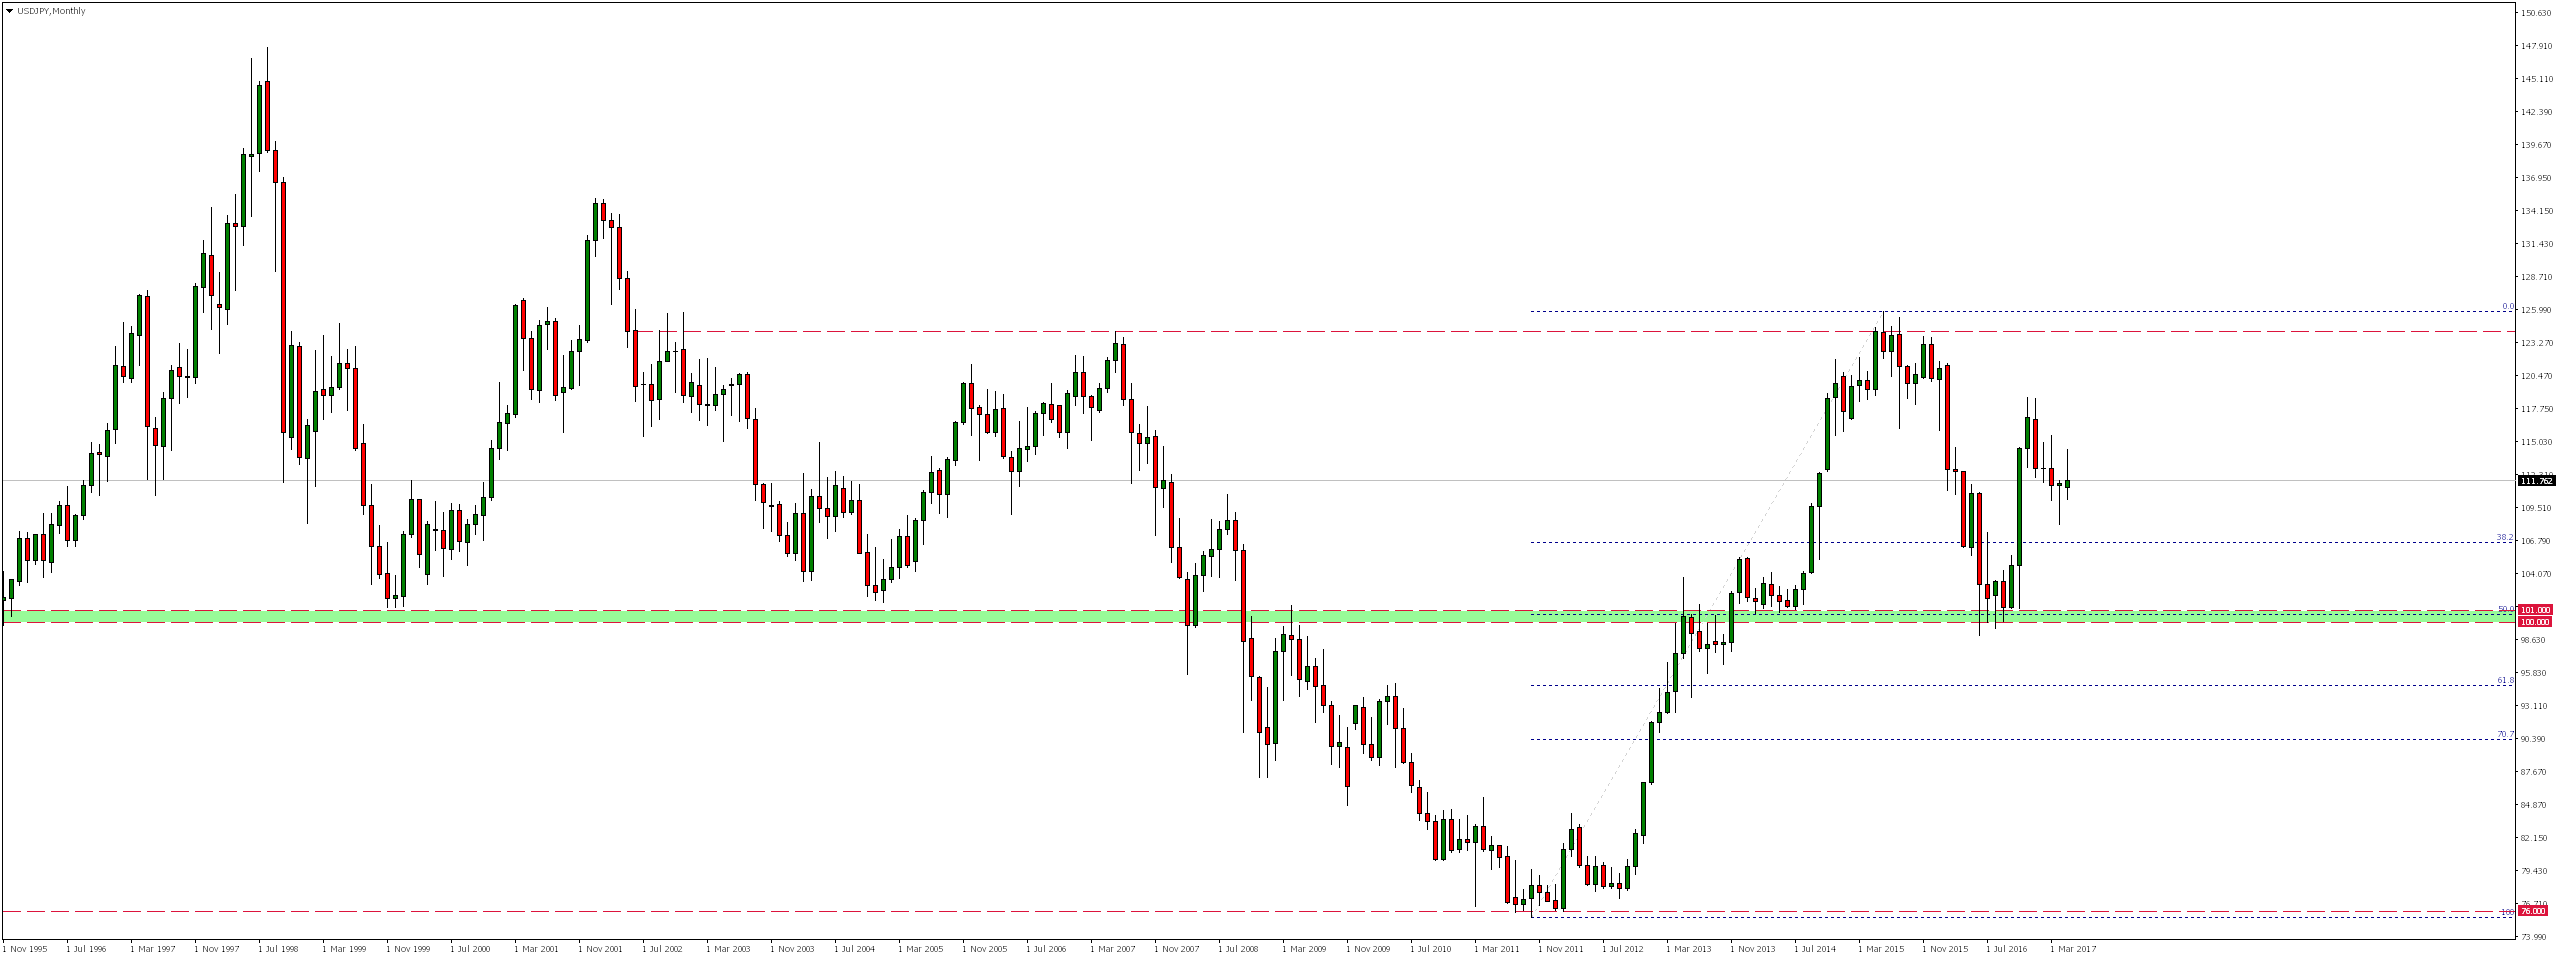
As a result of declines on USDJPY, which lasted from June 2015, exactly after one year quotations reached significant support, converging very precisely with 50% of the Fibonacci correction from earlier gains. There supply strength weakened significantly and after few months of consolidation there was a very strong demand response, which led to bullish impulse lasting for three consecutive months.
Looking at weekly chart, we notice that these gains reached downward trend line where in December there was reaction of supply side. Since then, we have seen weak declines that appear to be only a correction before next bullish impulse.
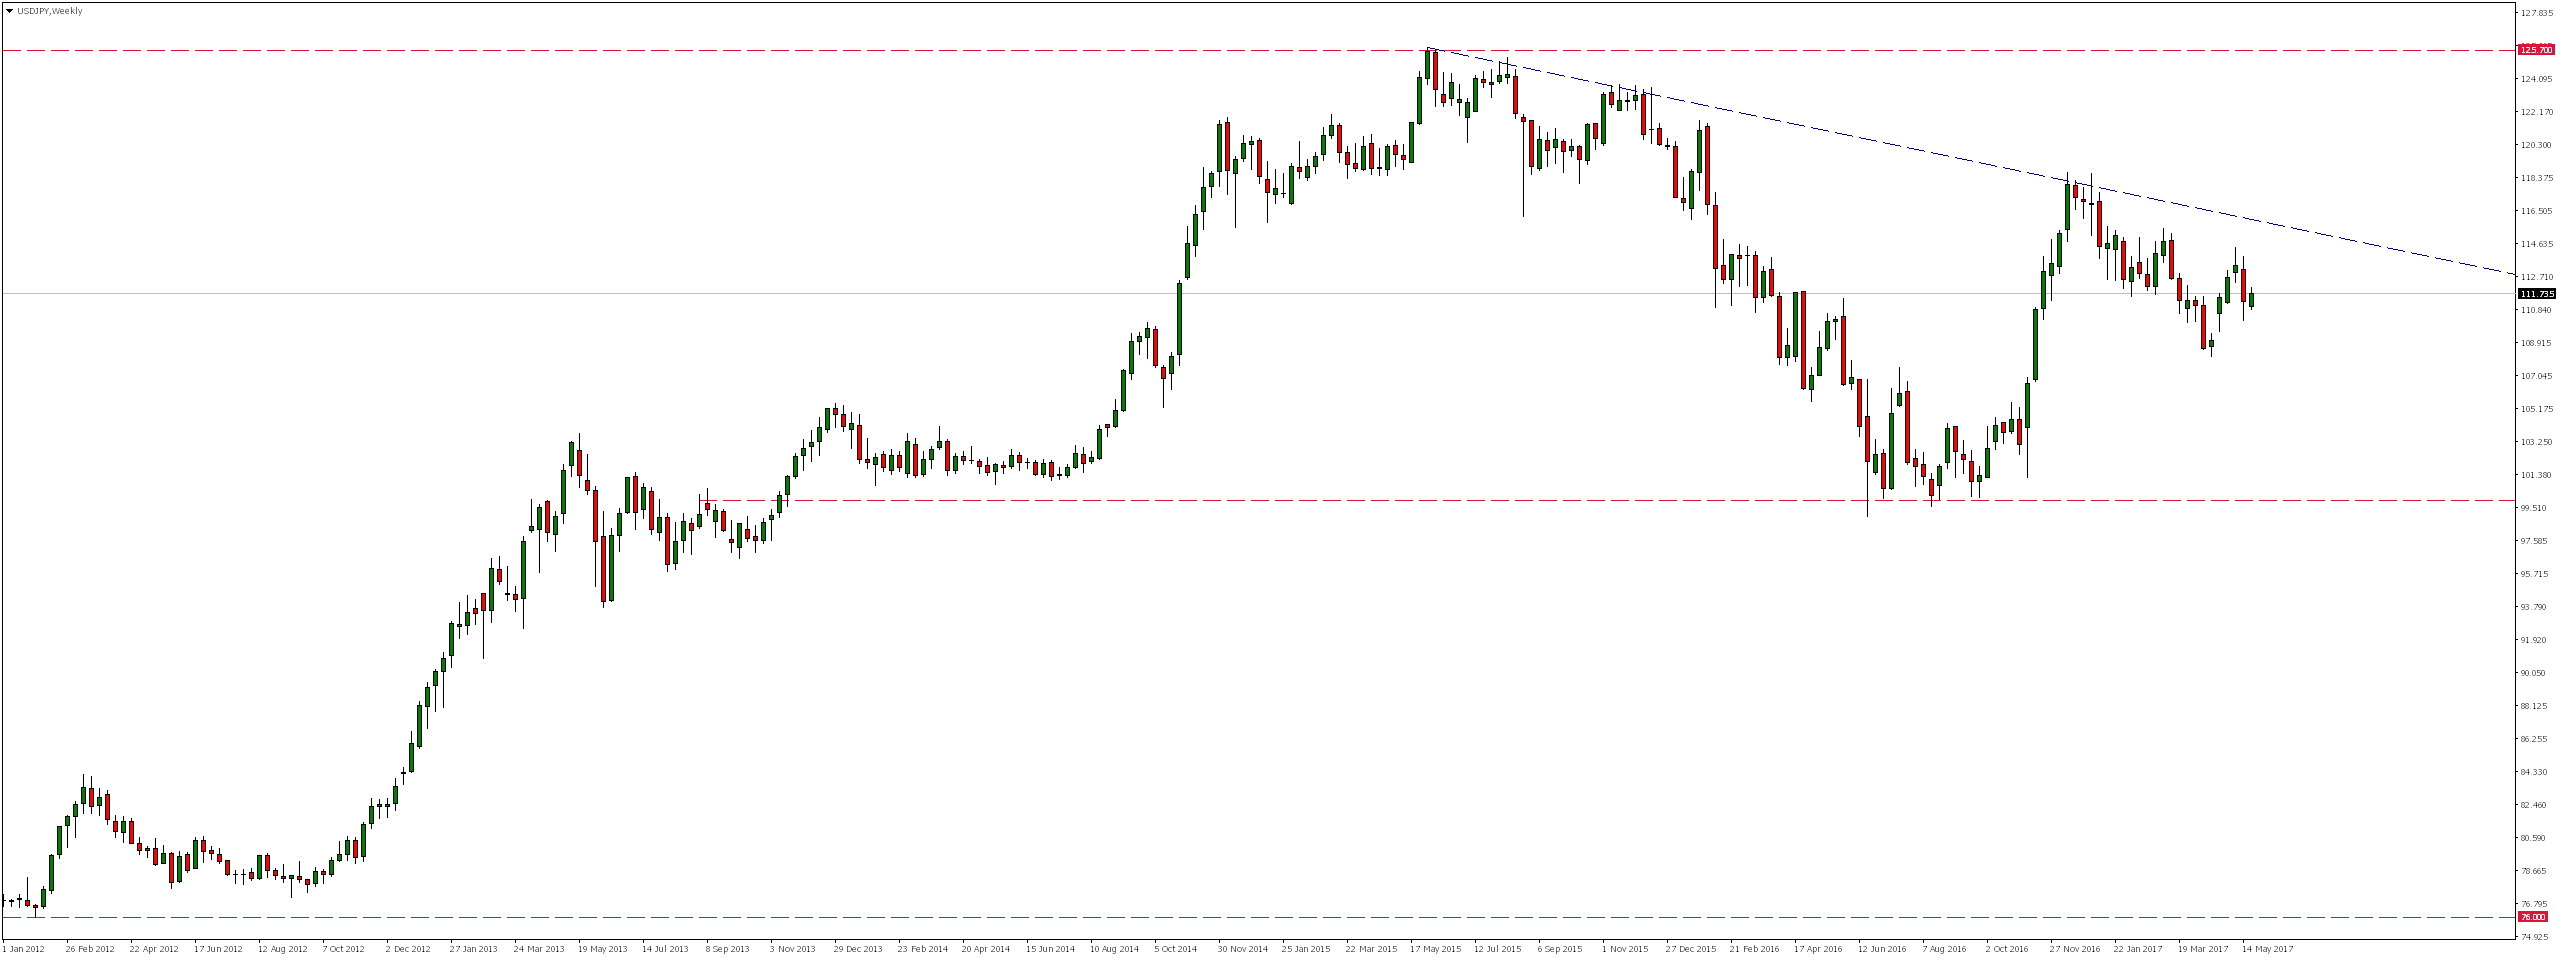
On daily chart, however, we will note that as a result of these falls market has already beaten uptrend line, which repeatedly was re-tested from below (as a resistance).

H4 chart shows that market has been quietly moving north for a week. These increases are significantly less dynamic than earlier falls, and they are more likely to be correction. So it seems that in near future we would expect supply reaction and a further bearish impulse.
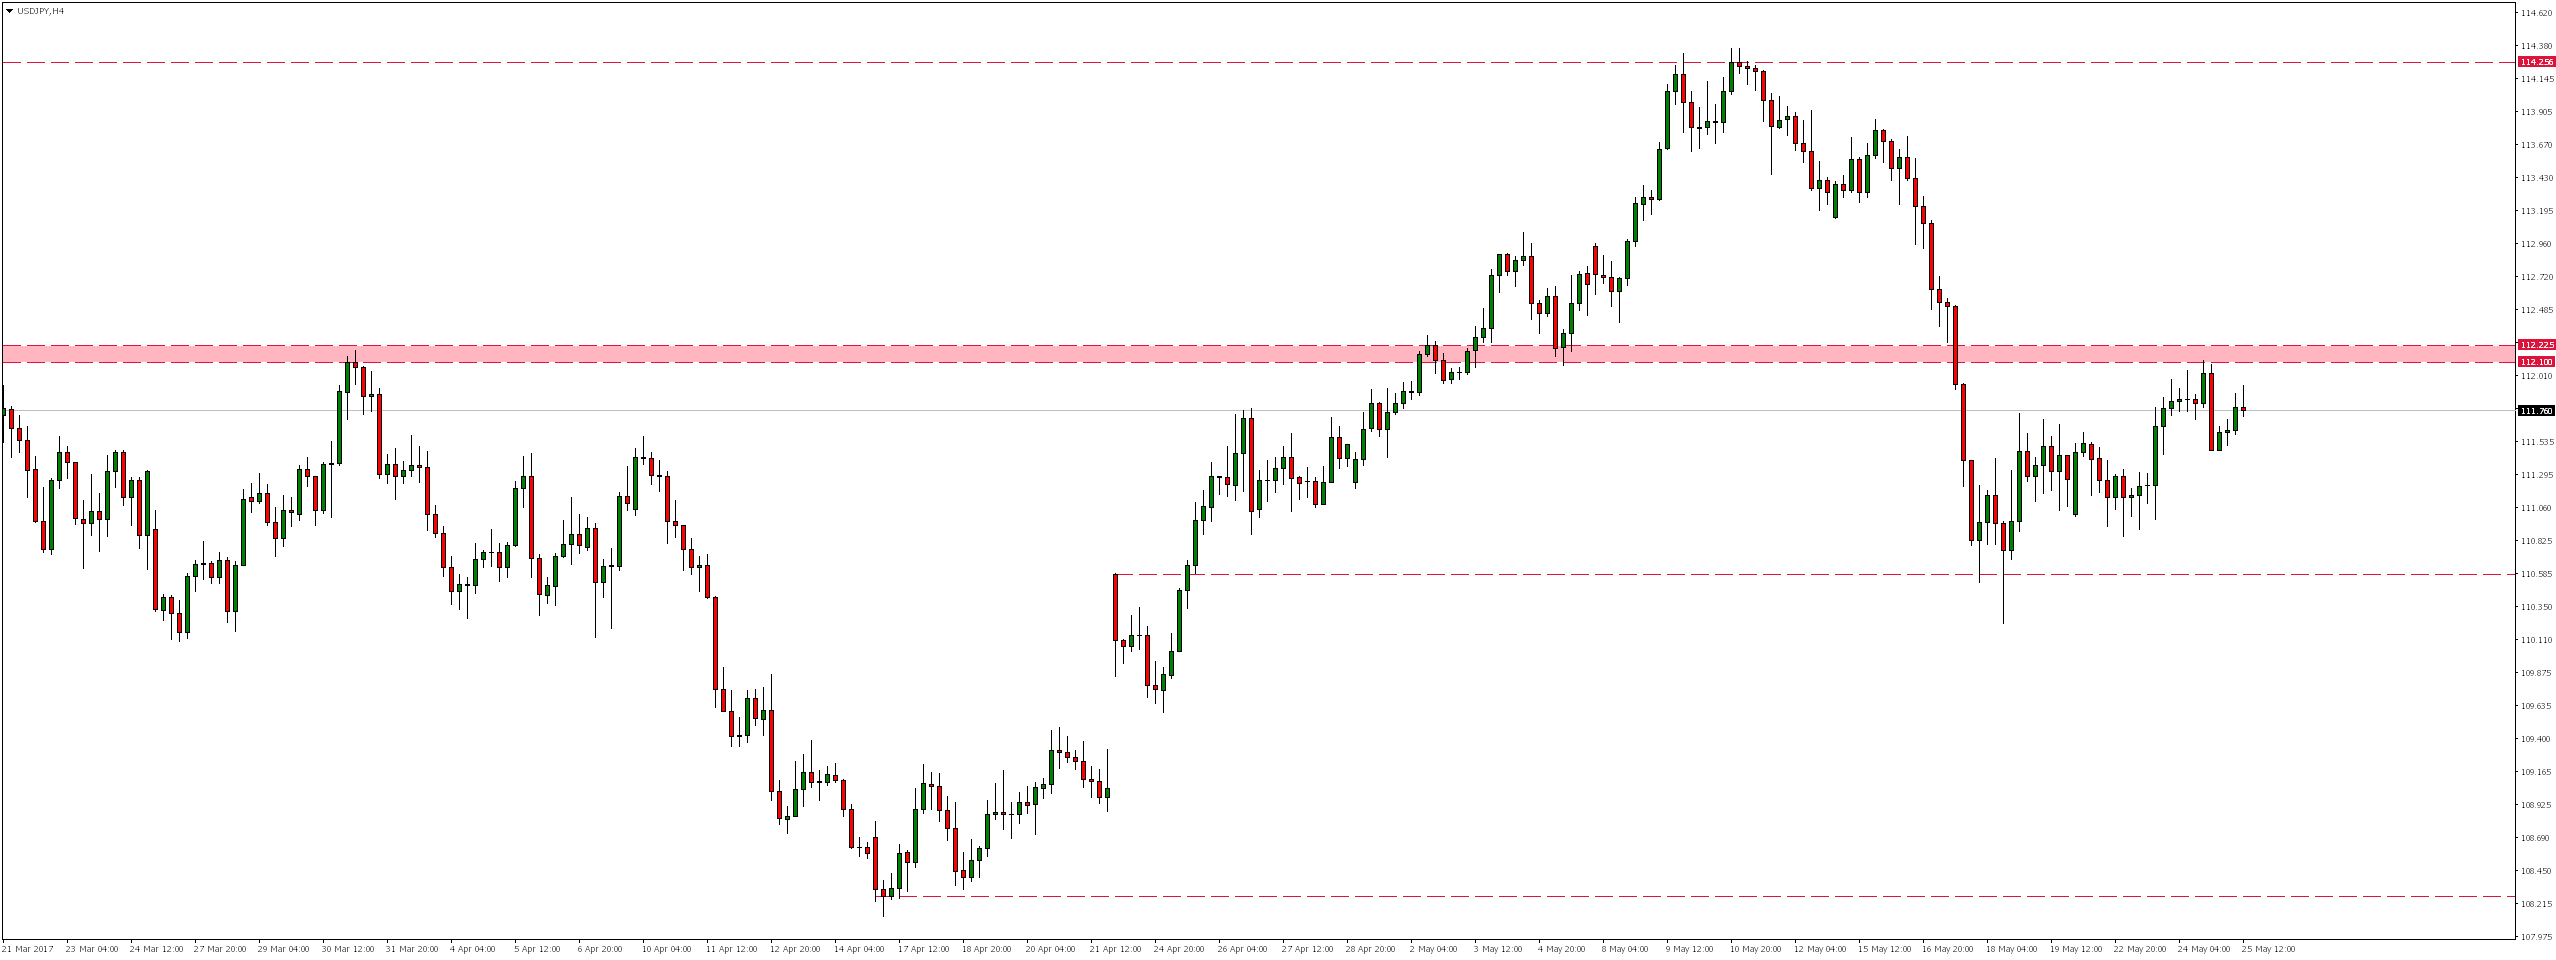
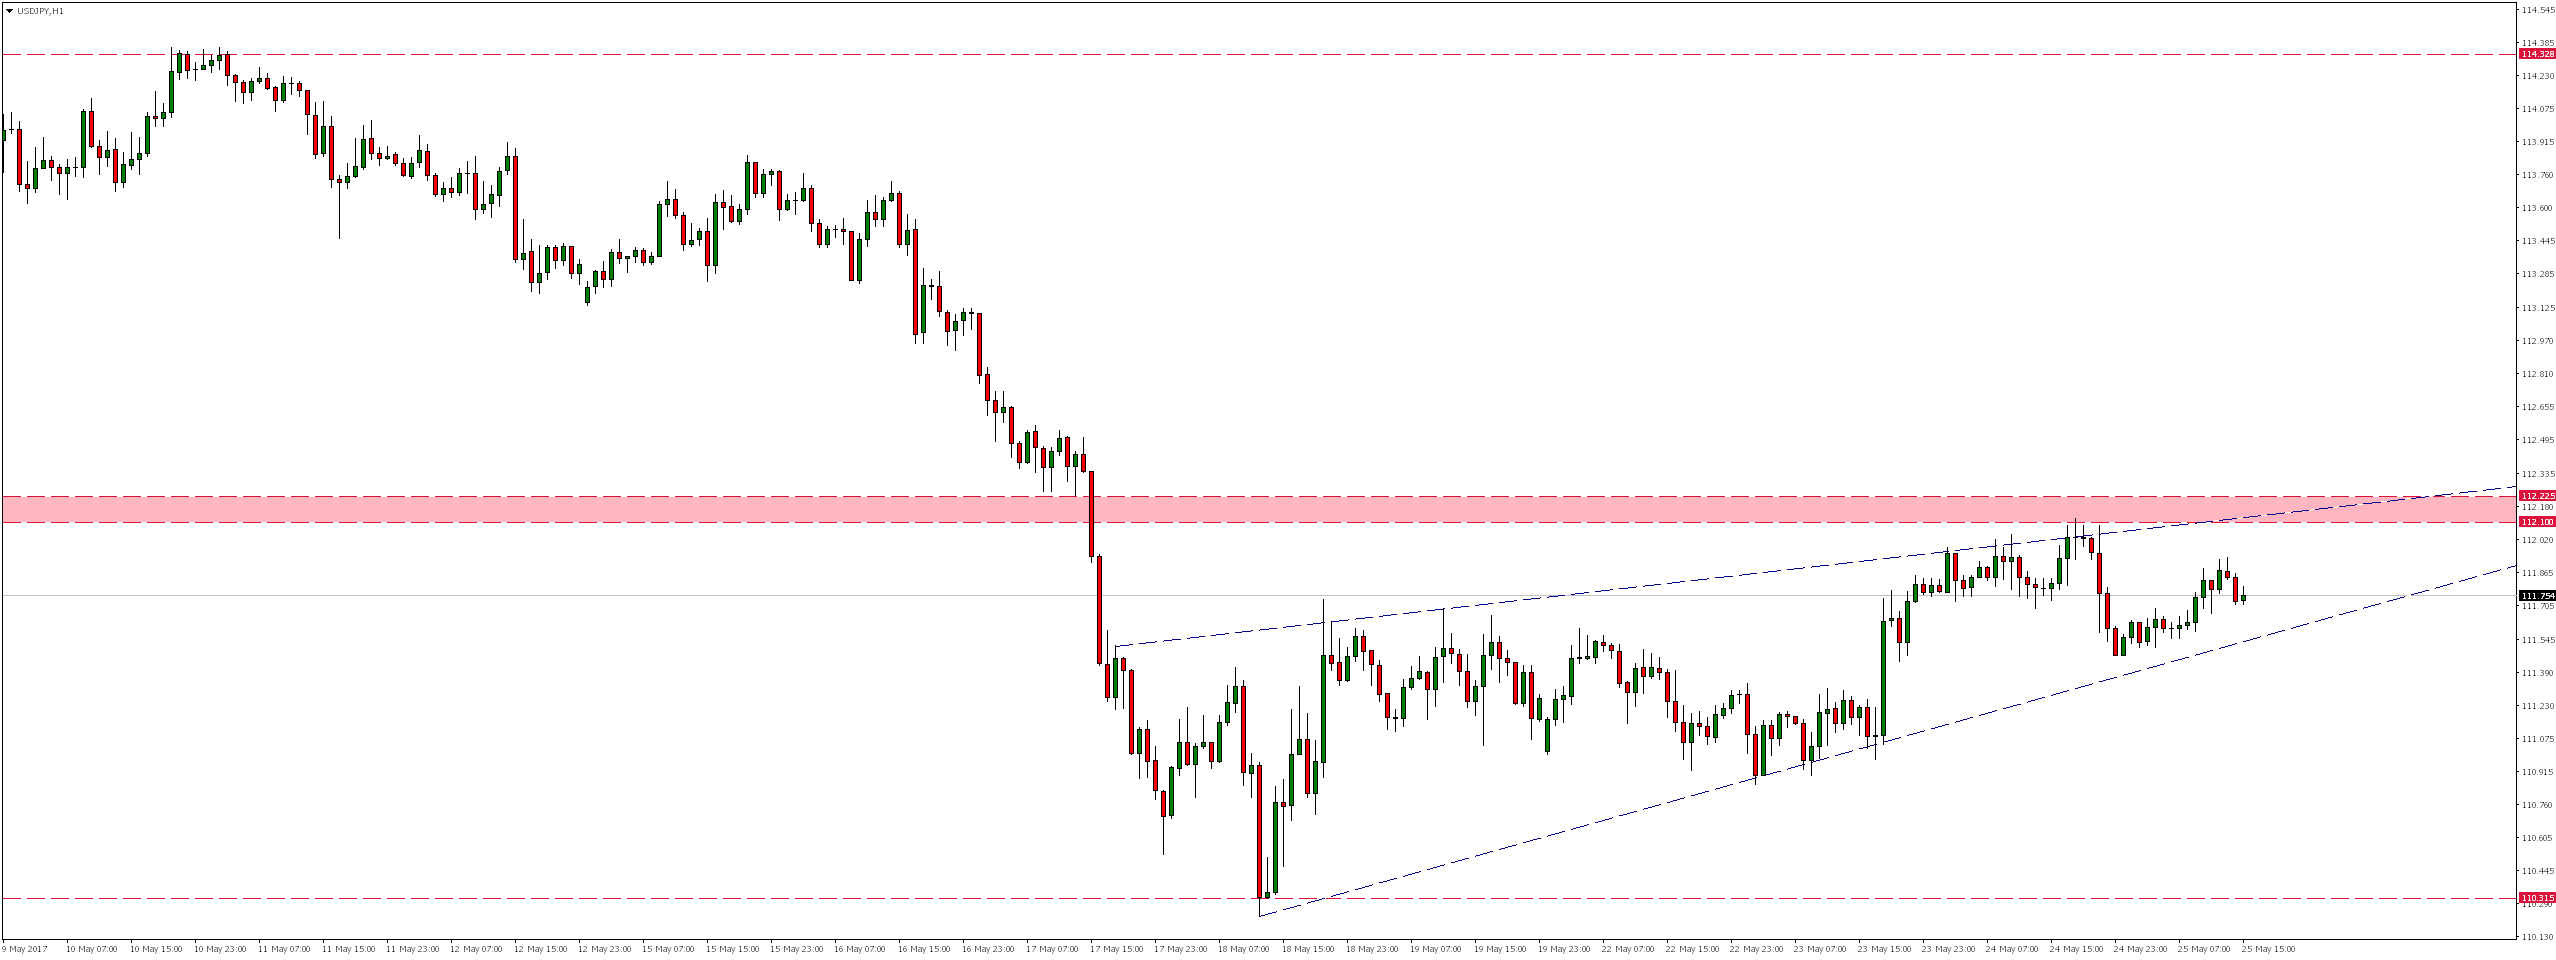
However, for that to happen, we would have to break the bottom of the formation ascending wedge.


 Review")


