From investor to a scalper is a cycle of analysis in which we take one financial instrument each day and the analysis includes a detailed look at the value from the monthly/weekly to the H1/M15 chart.
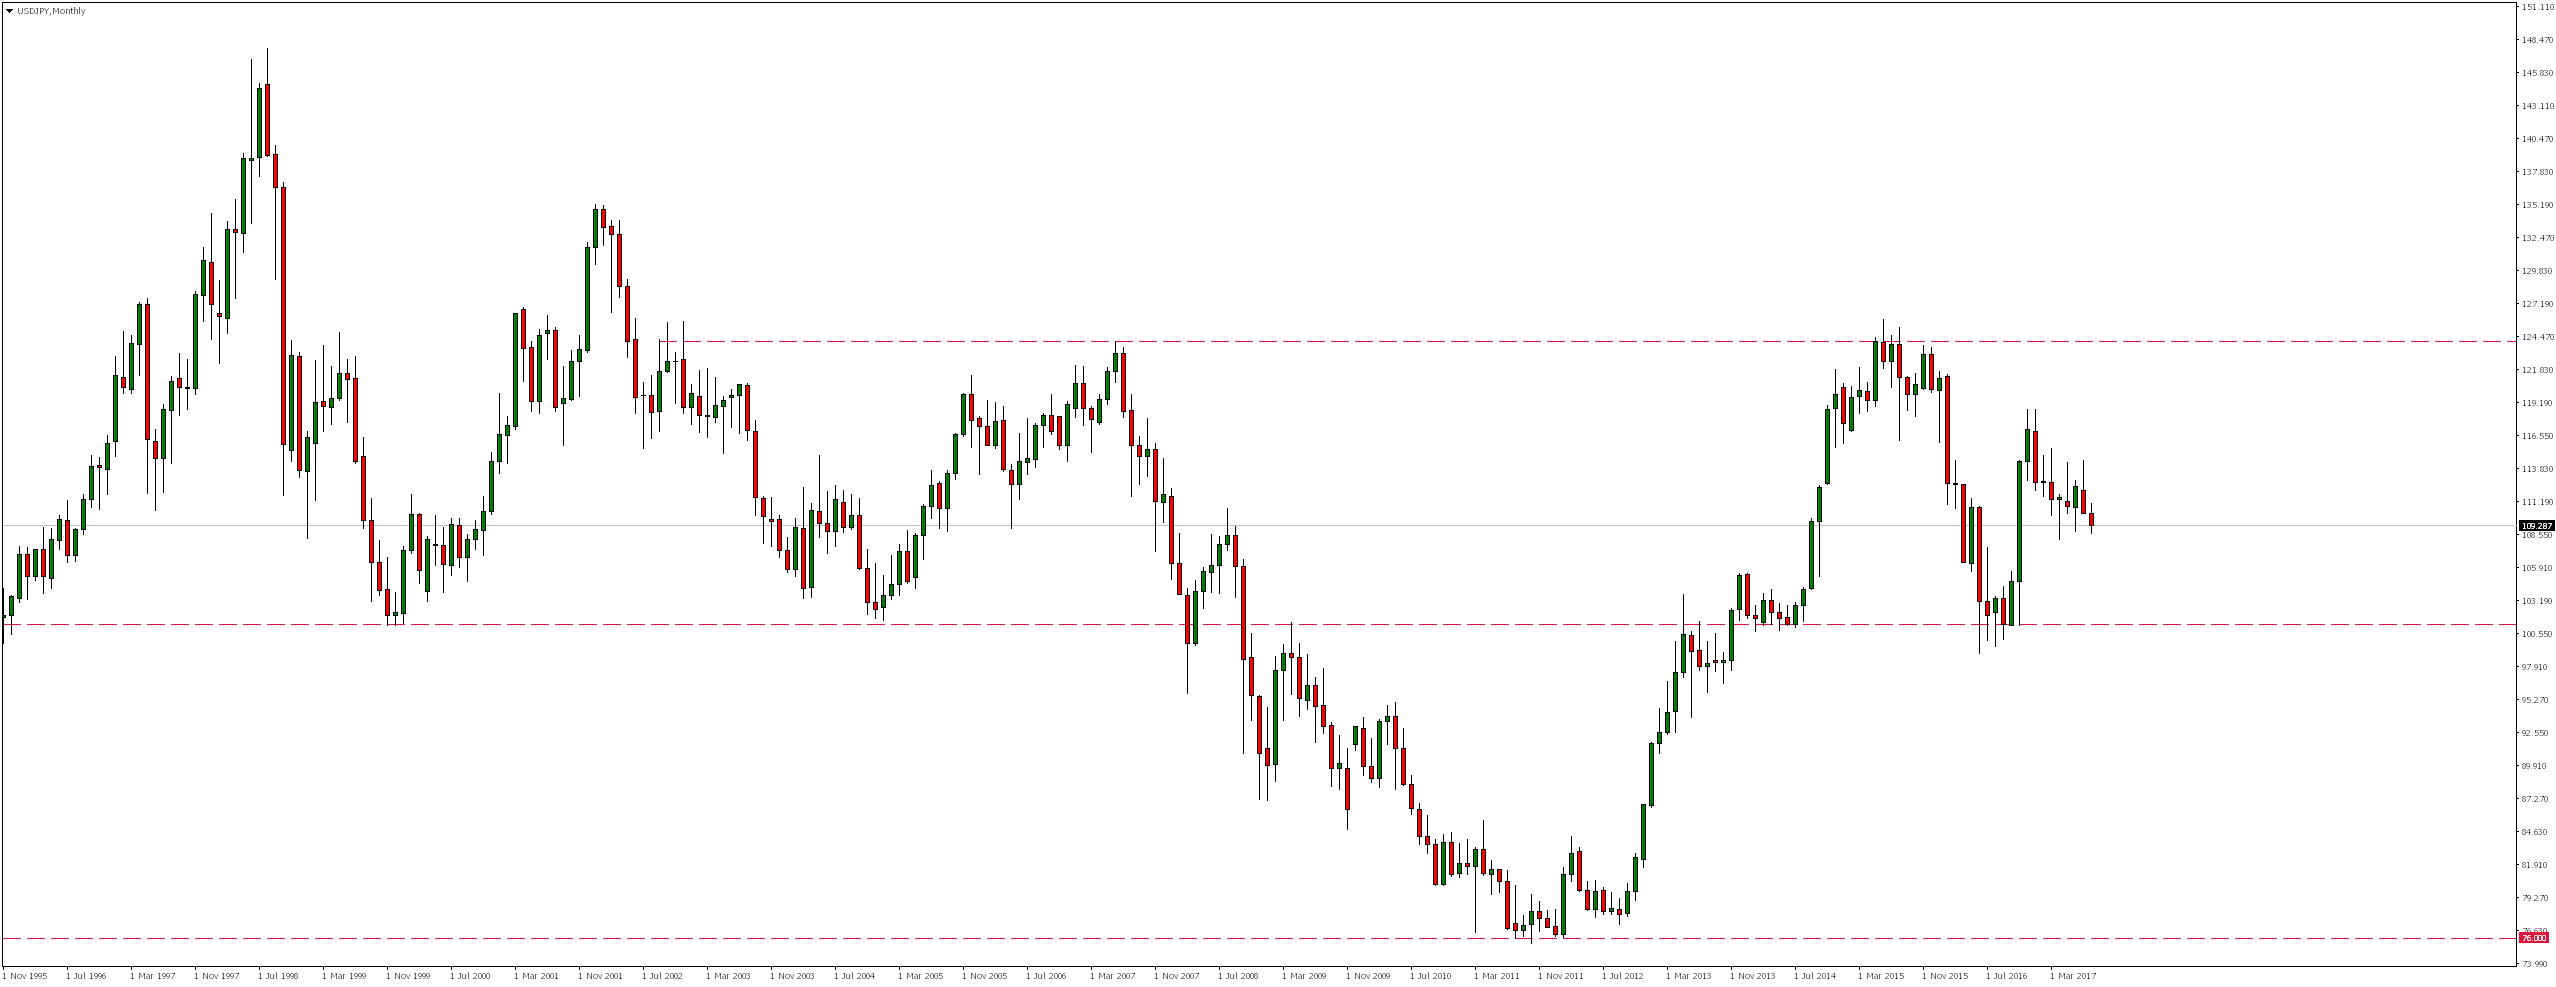
USDJPY as a result of declines, which lasted from June 2015, exactly one year later reached near a critical support, converging very precisely with 50% of the Fibonacci correction from earlier gains. There, the supply force decisively weakened and after a few months of consolidation there was a very strong demand response, which resulted in a dynamic growth for the next three months.
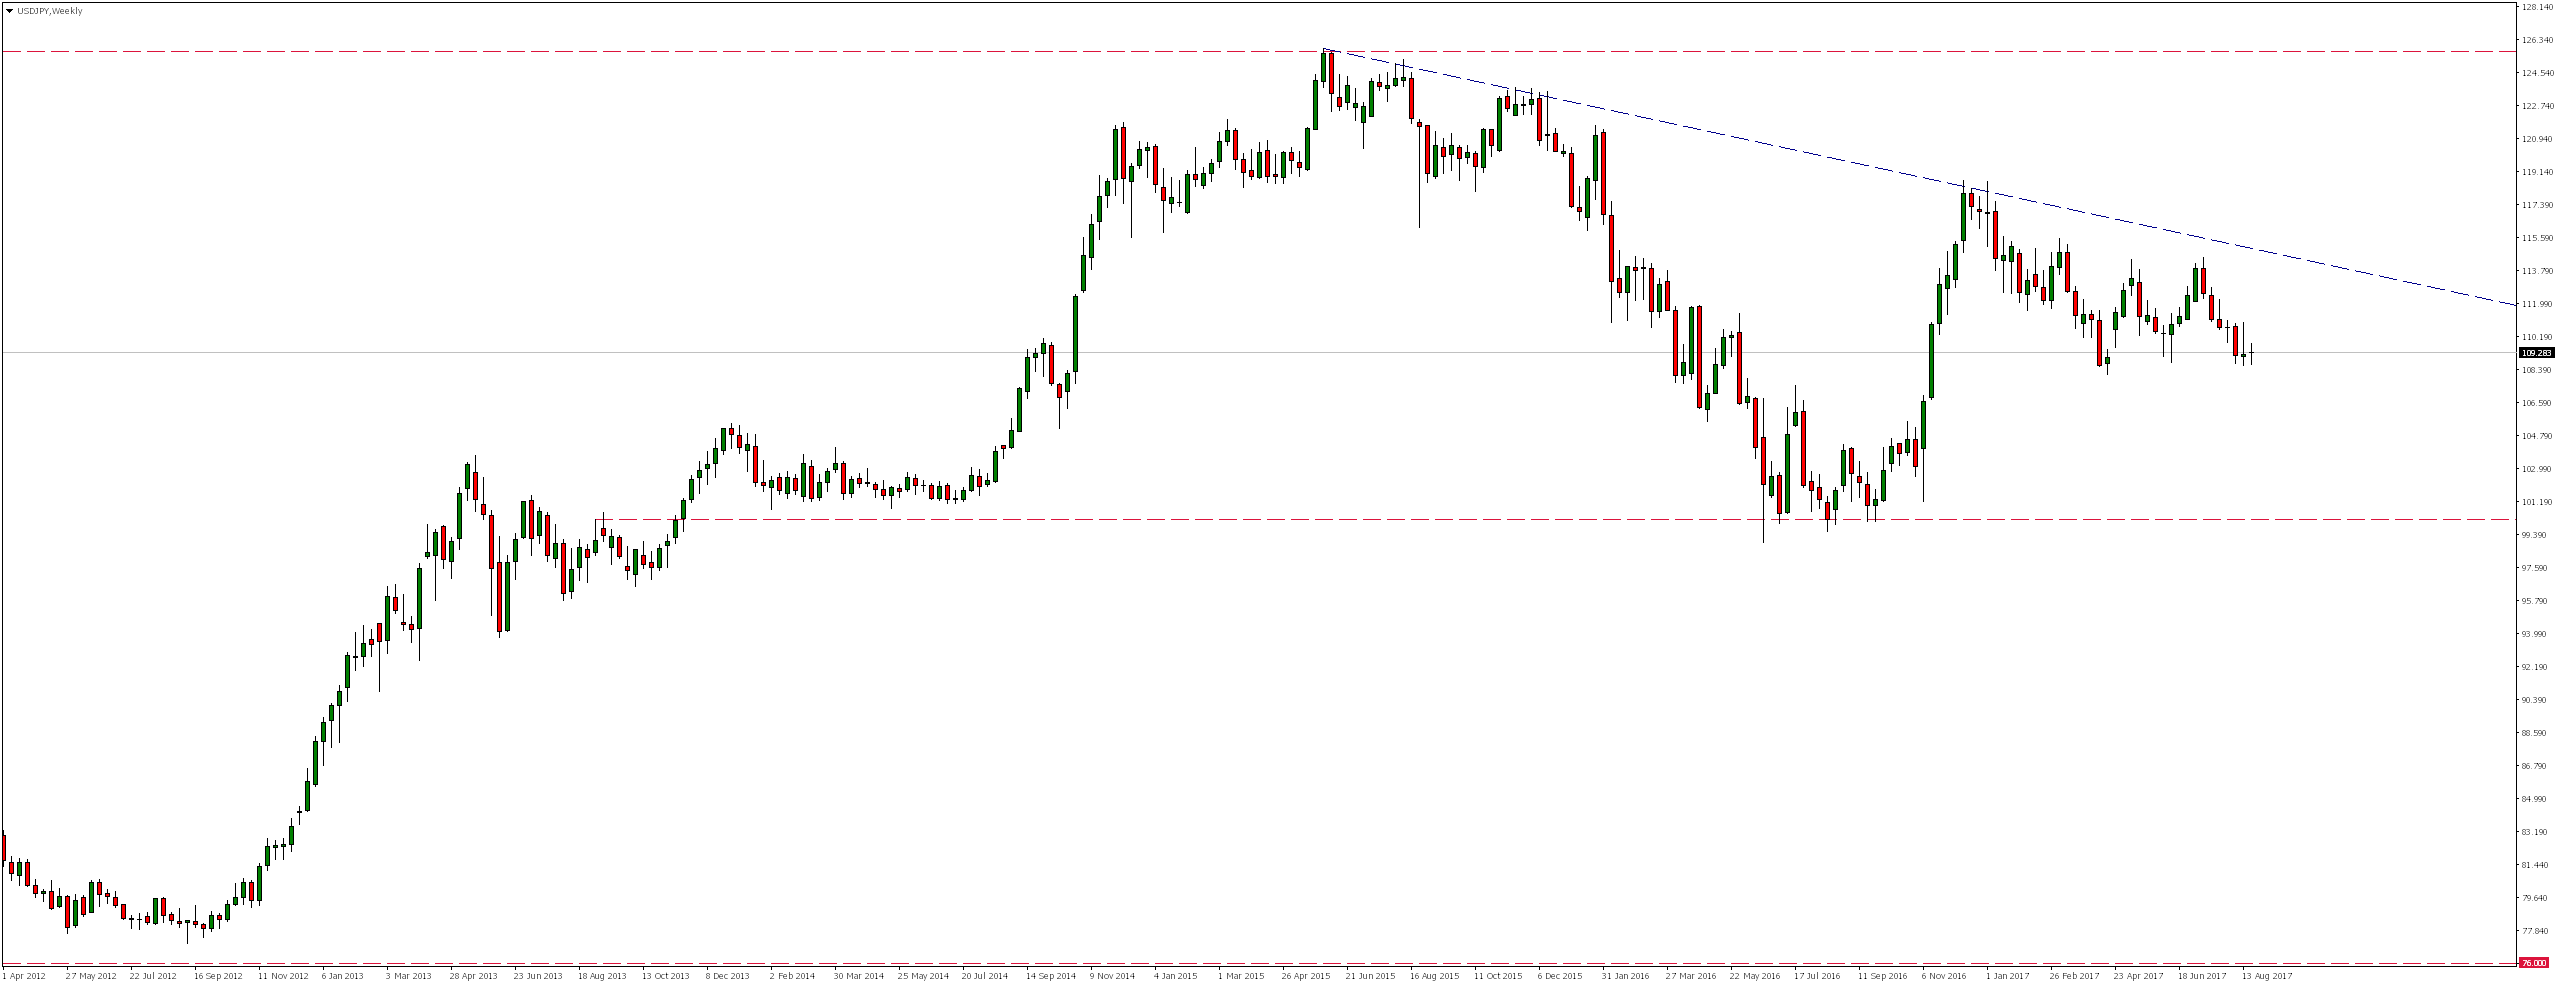
Looking at the weekly chart, we see that these gains reached the downward trend line, where in December there was a supply reaction. Since then, we have seen calm declines that appear to be only a correction before the next growth impulse.
On the daily chart we notice that the market has been moving for a long time in a horizontal trend (consolidation). Currently price of this pair oscillates around lower limit of this box, and if only a strong demand response occurs in the near future, we could expect a rebound.
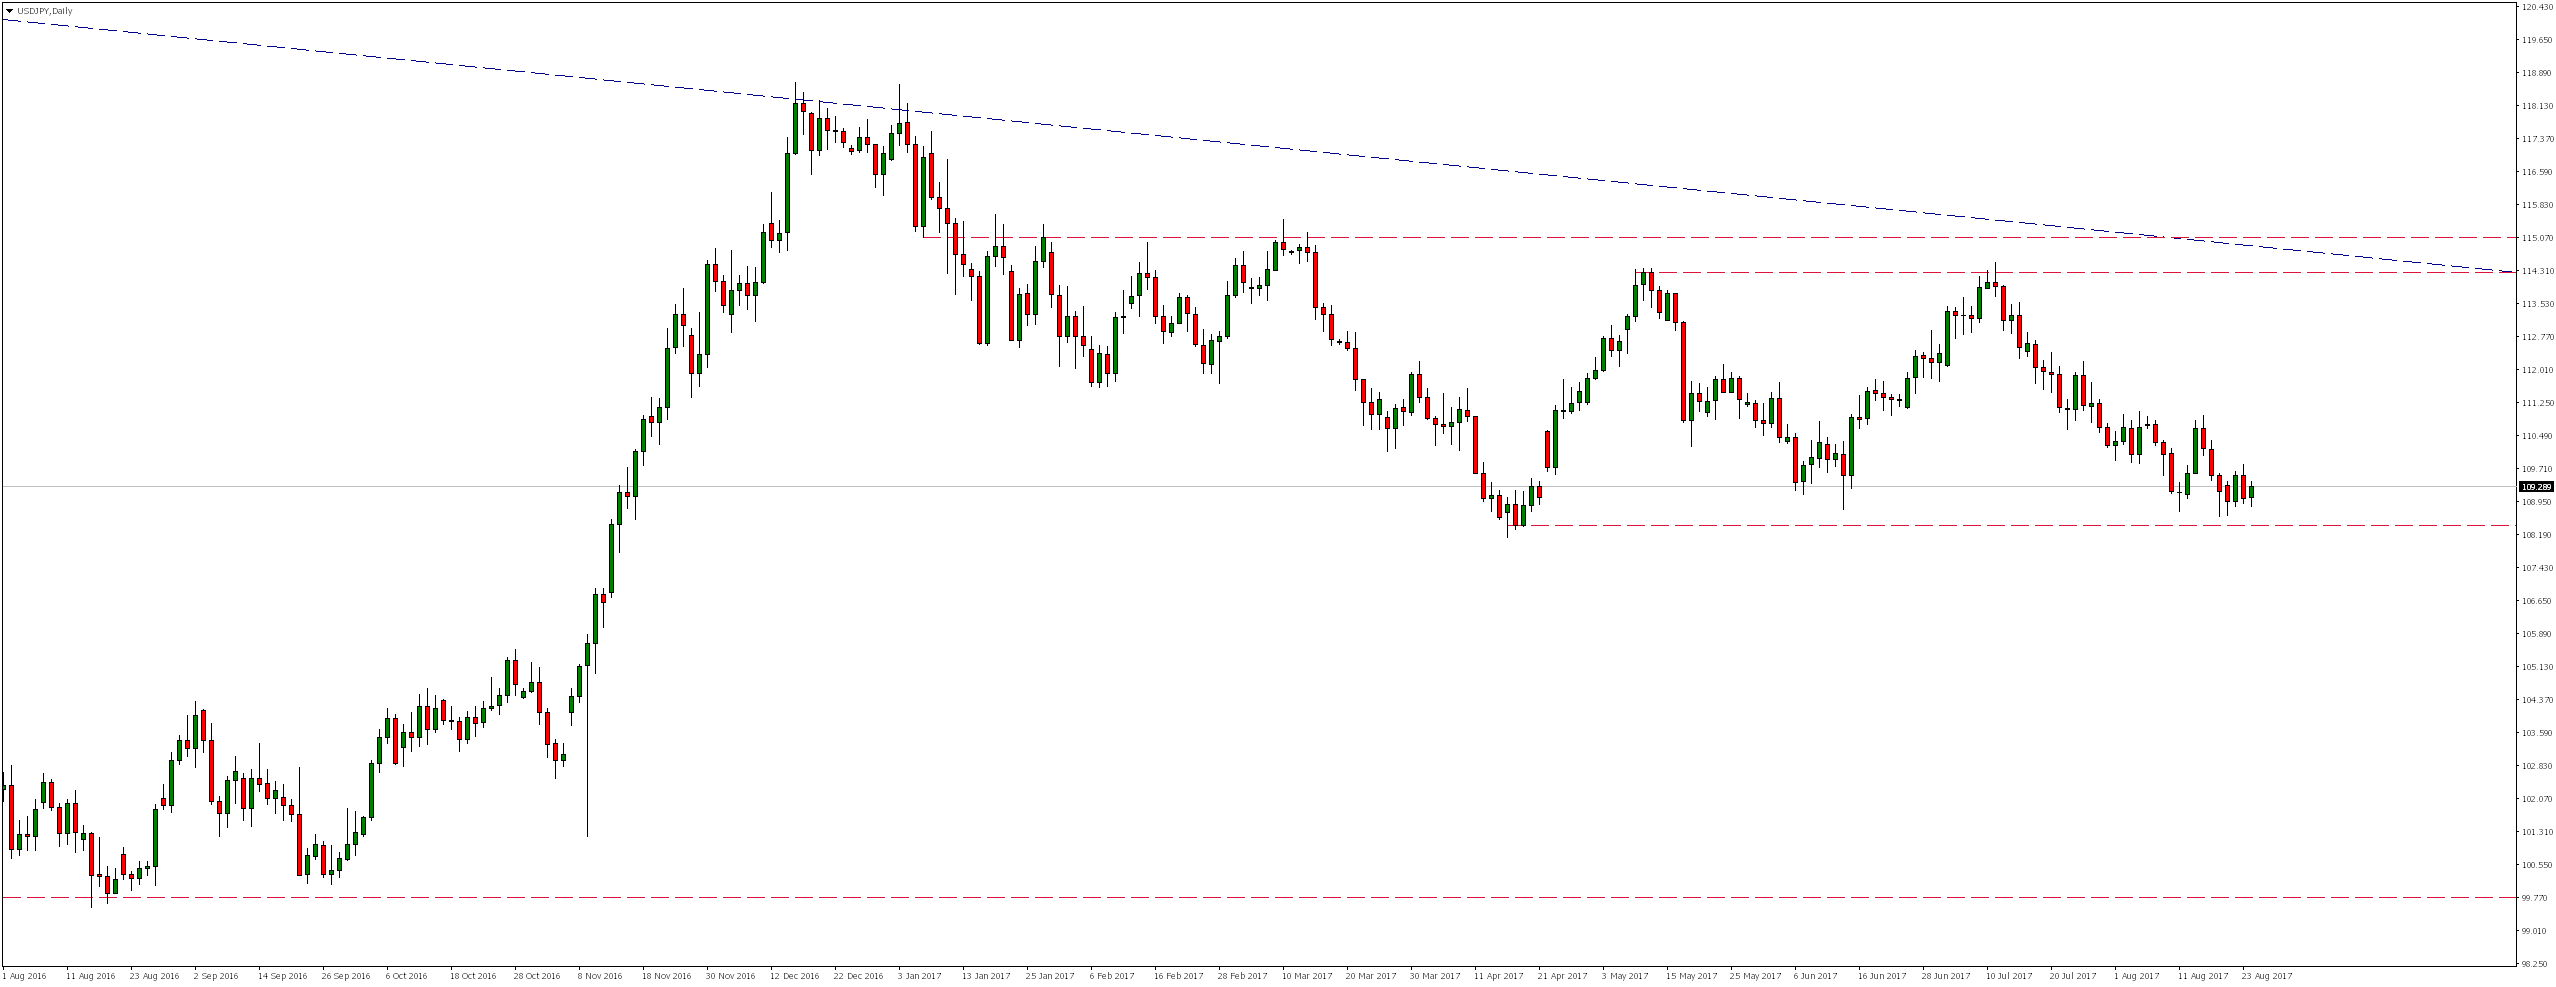
Despite the fact that the market did not reach the lower limit of this consolidation, around 50 pips above that level a bullish response occurred few times.
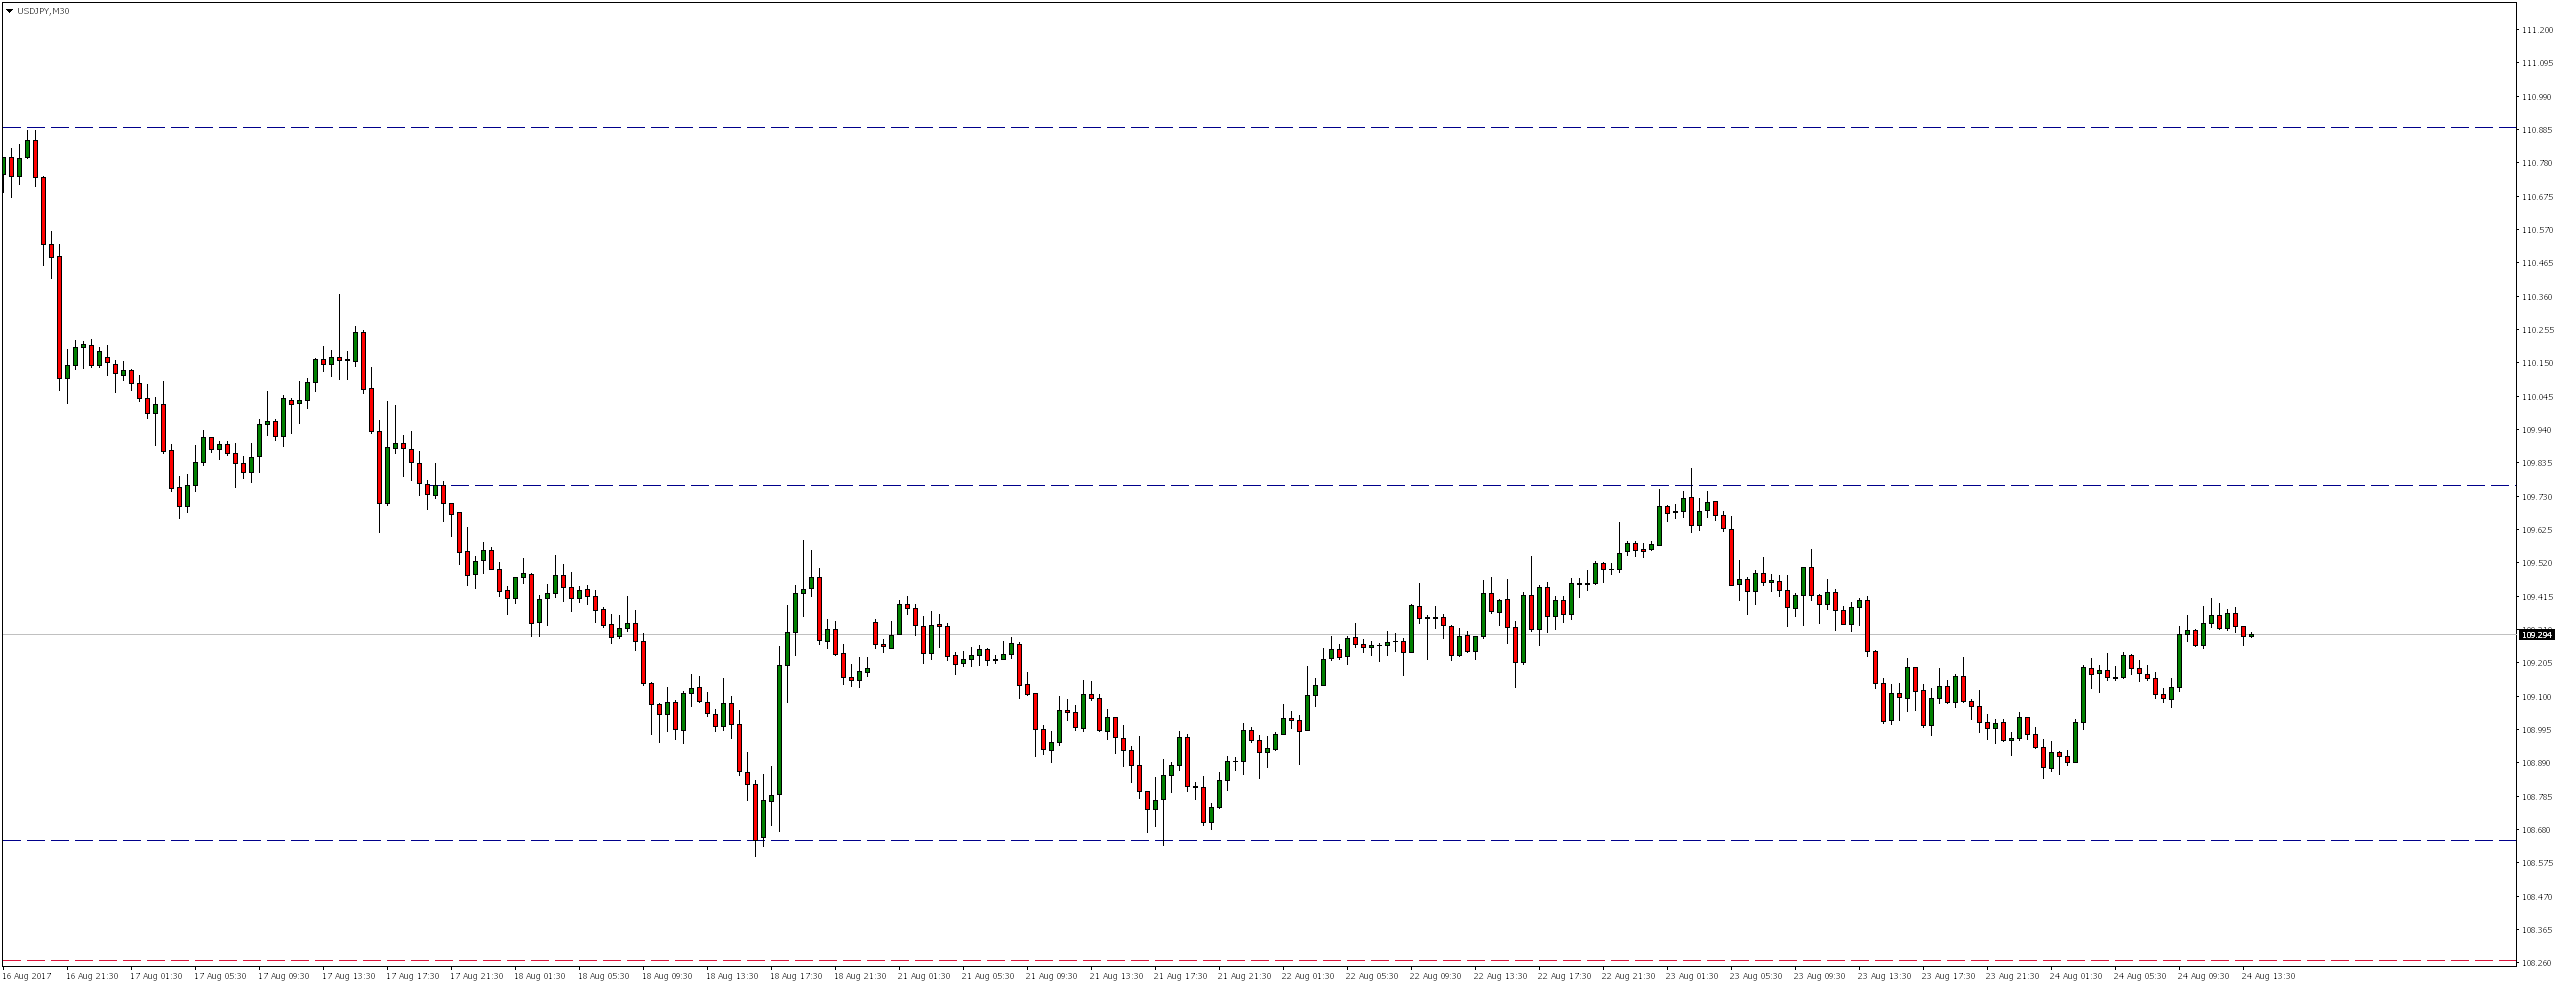
On H4 chart we notice that the market is moving in consolidation inside which a smaller (yellow) box has formed, whose upper limit precisely coincides with 50% of the Fibonacci correction.
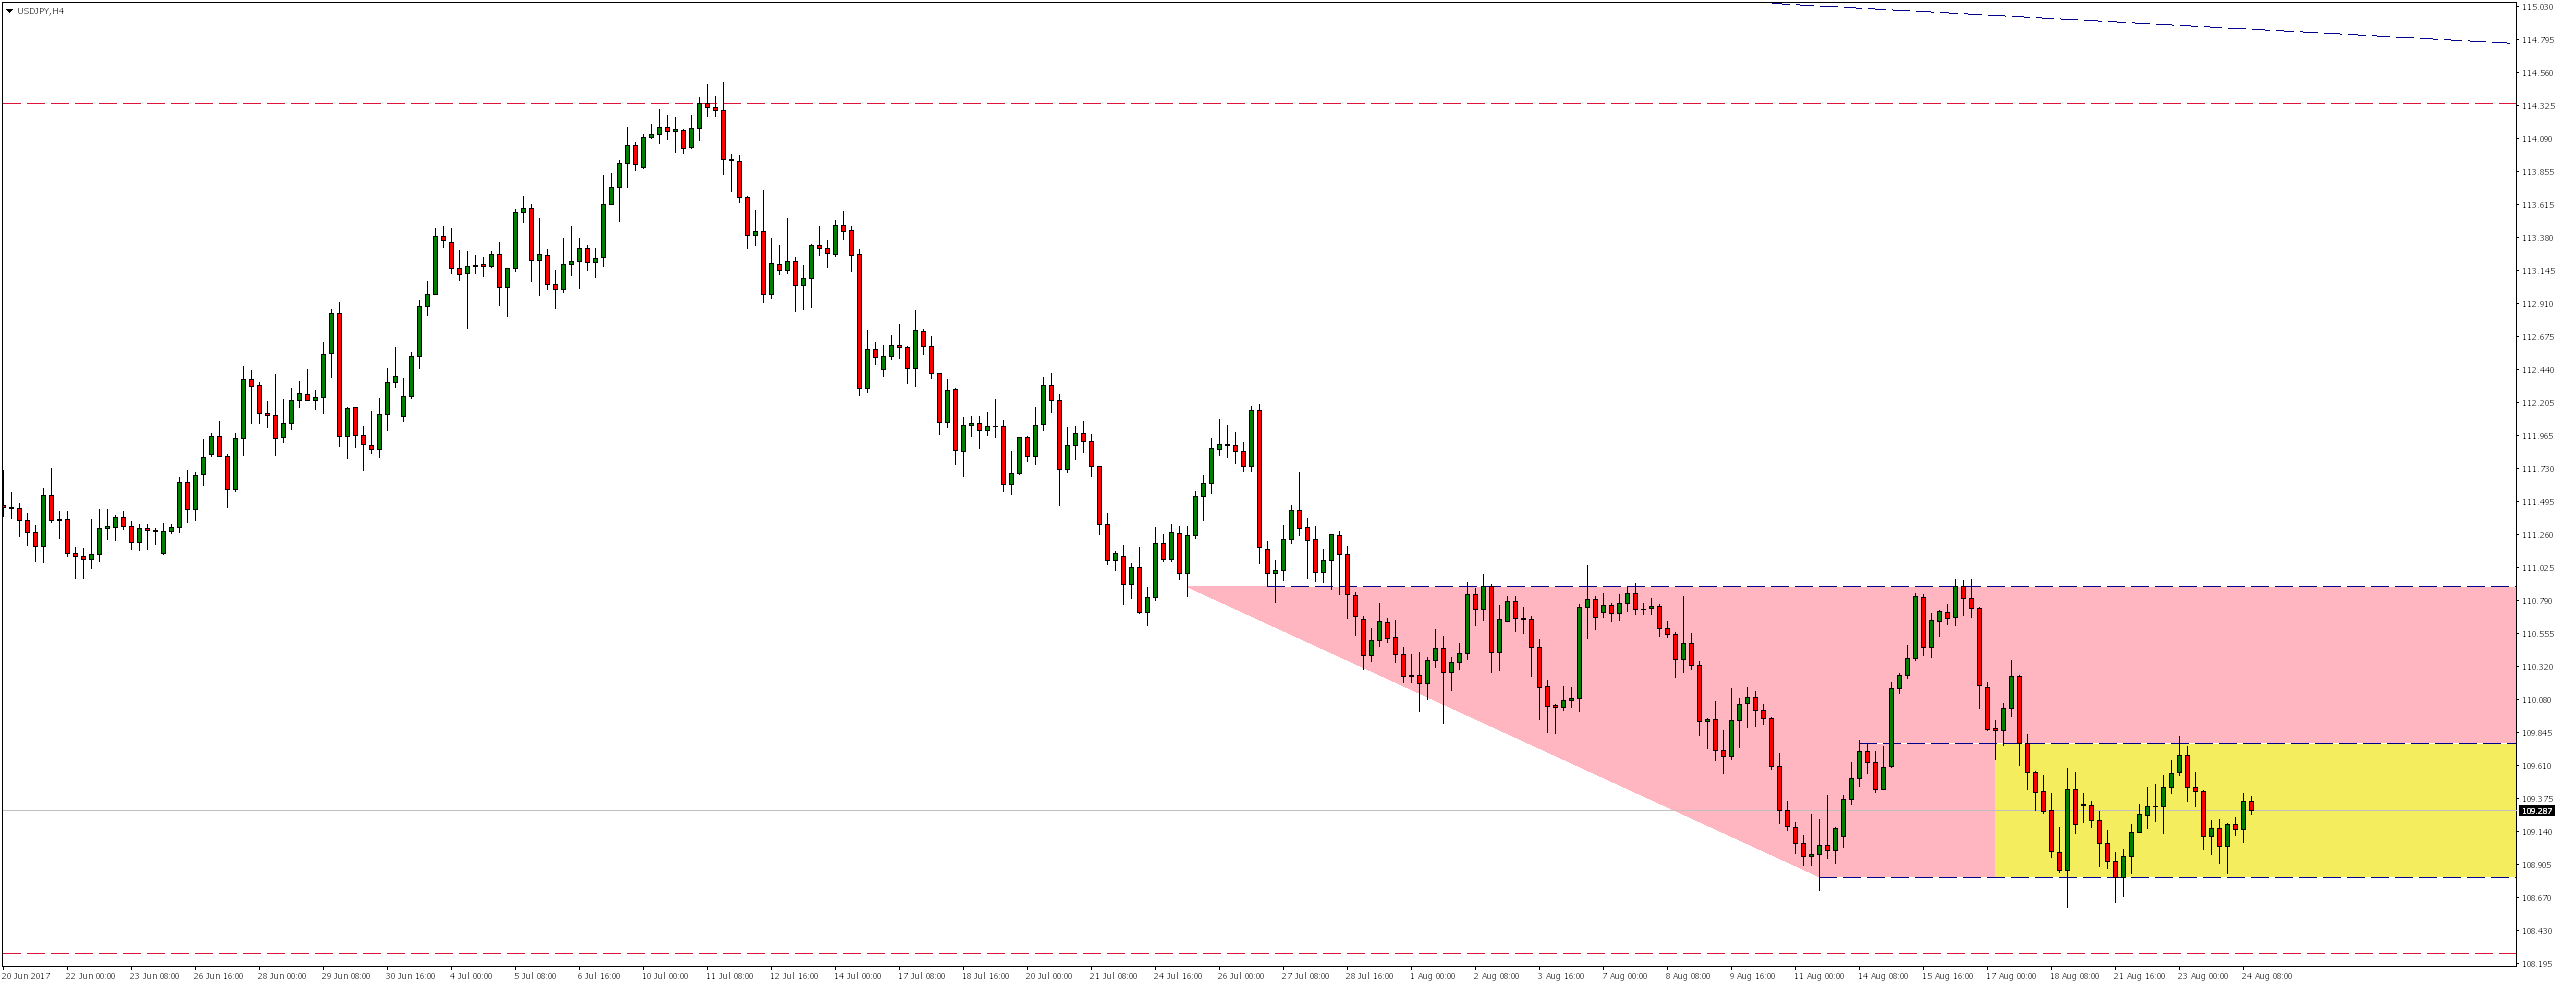
Breaking out in either side could determine the future direction of movement on this pair.
![]()
![]() STO is a broker regulated by FCA and CySEC. It offers more than 300 financial instruments such as Forex, Indices, Oil, Stocks, Commodities and Bonds. STO clients have possibility to trade thanks to reliable MT4 and AFX FAST platforms. Check STO offer!
STO is a broker regulated by FCA and CySEC. It offers more than 300 financial instruments such as Forex, Indices, Oil, Stocks, Commodities and Bonds. STO clients have possibility to trade thanks to reliable MT4 and AFX FAST platforms. Check STO offer!


 Review")


