![]() From Investor to Scalper – series of studies created in cooperation with broker BDSwiss, in which we take a financial instrument and the analysis includes a detailed look at the value from the monthly chart and ending with 5/15 minutes.
From Investor to Scalper – series of studies created in cooperation with broker BDSwiss, in which we take a financial instrument and the analysis includes a detailed look at the value from the monthly chart and ending with 5/15 minutes.
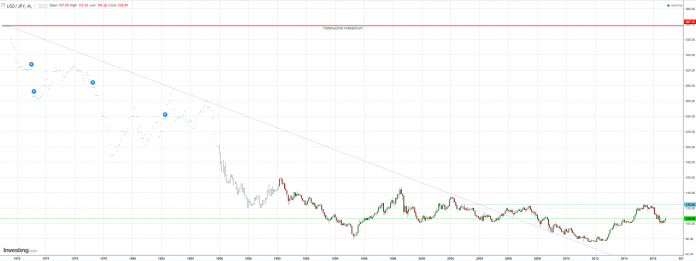
On historical chart we see that the currency pair USDJPY from the very beginning of their trading moves south. It is worth noting that in October 2005, market breakout top line of the downtrend, however, growth reached only at the level of around 125.00. Subsequent declines repeatedly re-tested the mentioned trend line as support ultimately rejecting it but rises which came again in May 2015, reached only the aforementioned 125.00 level.

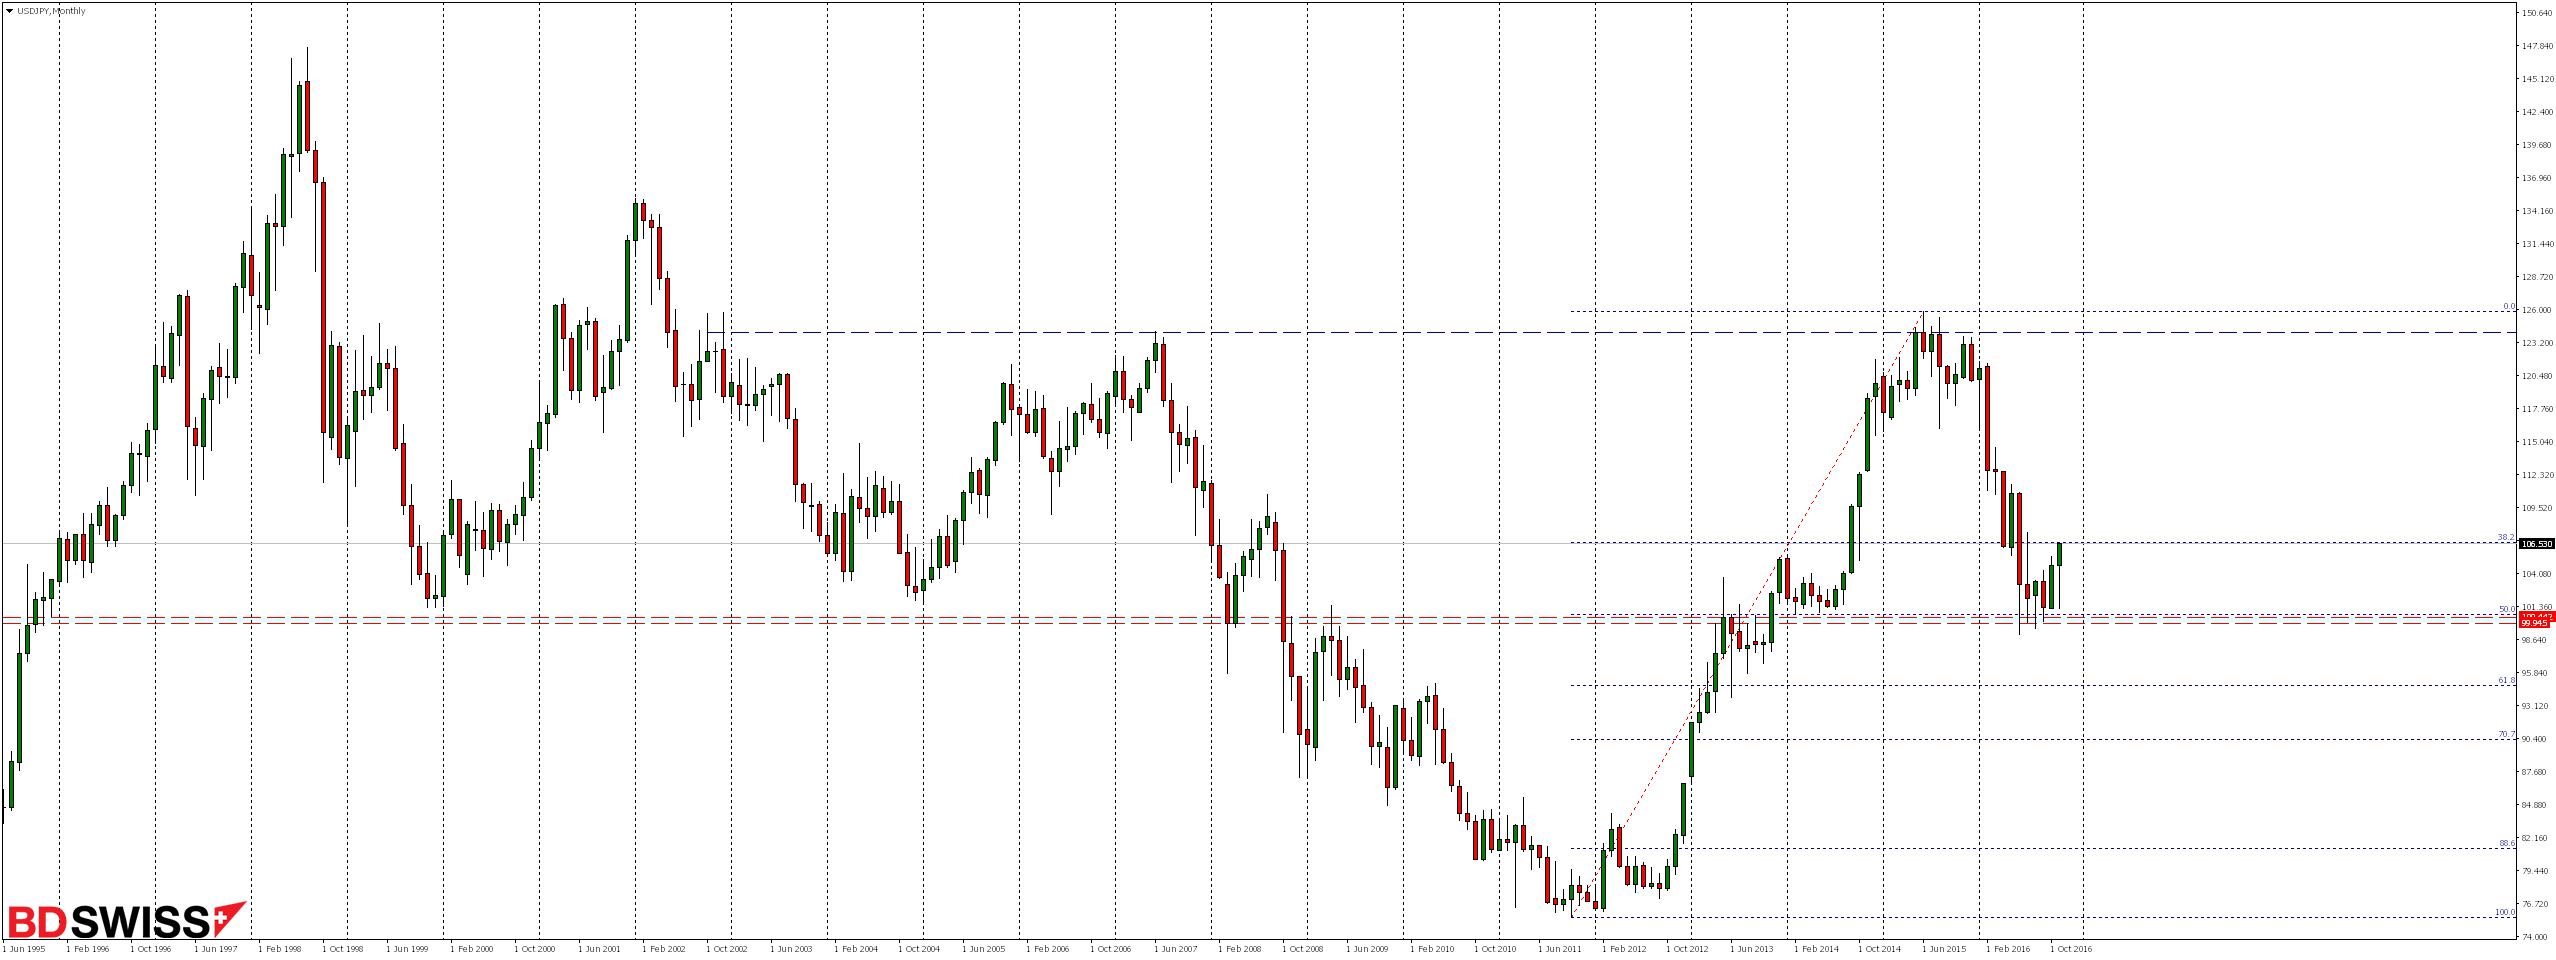
Looking a little closer at the current situation on the monthly graph notice that the ongoing declines since last year reached precisely in the vicinity of support zone coinciding with the momentum of 50% Fibonacci correction of the earlier upward movement.
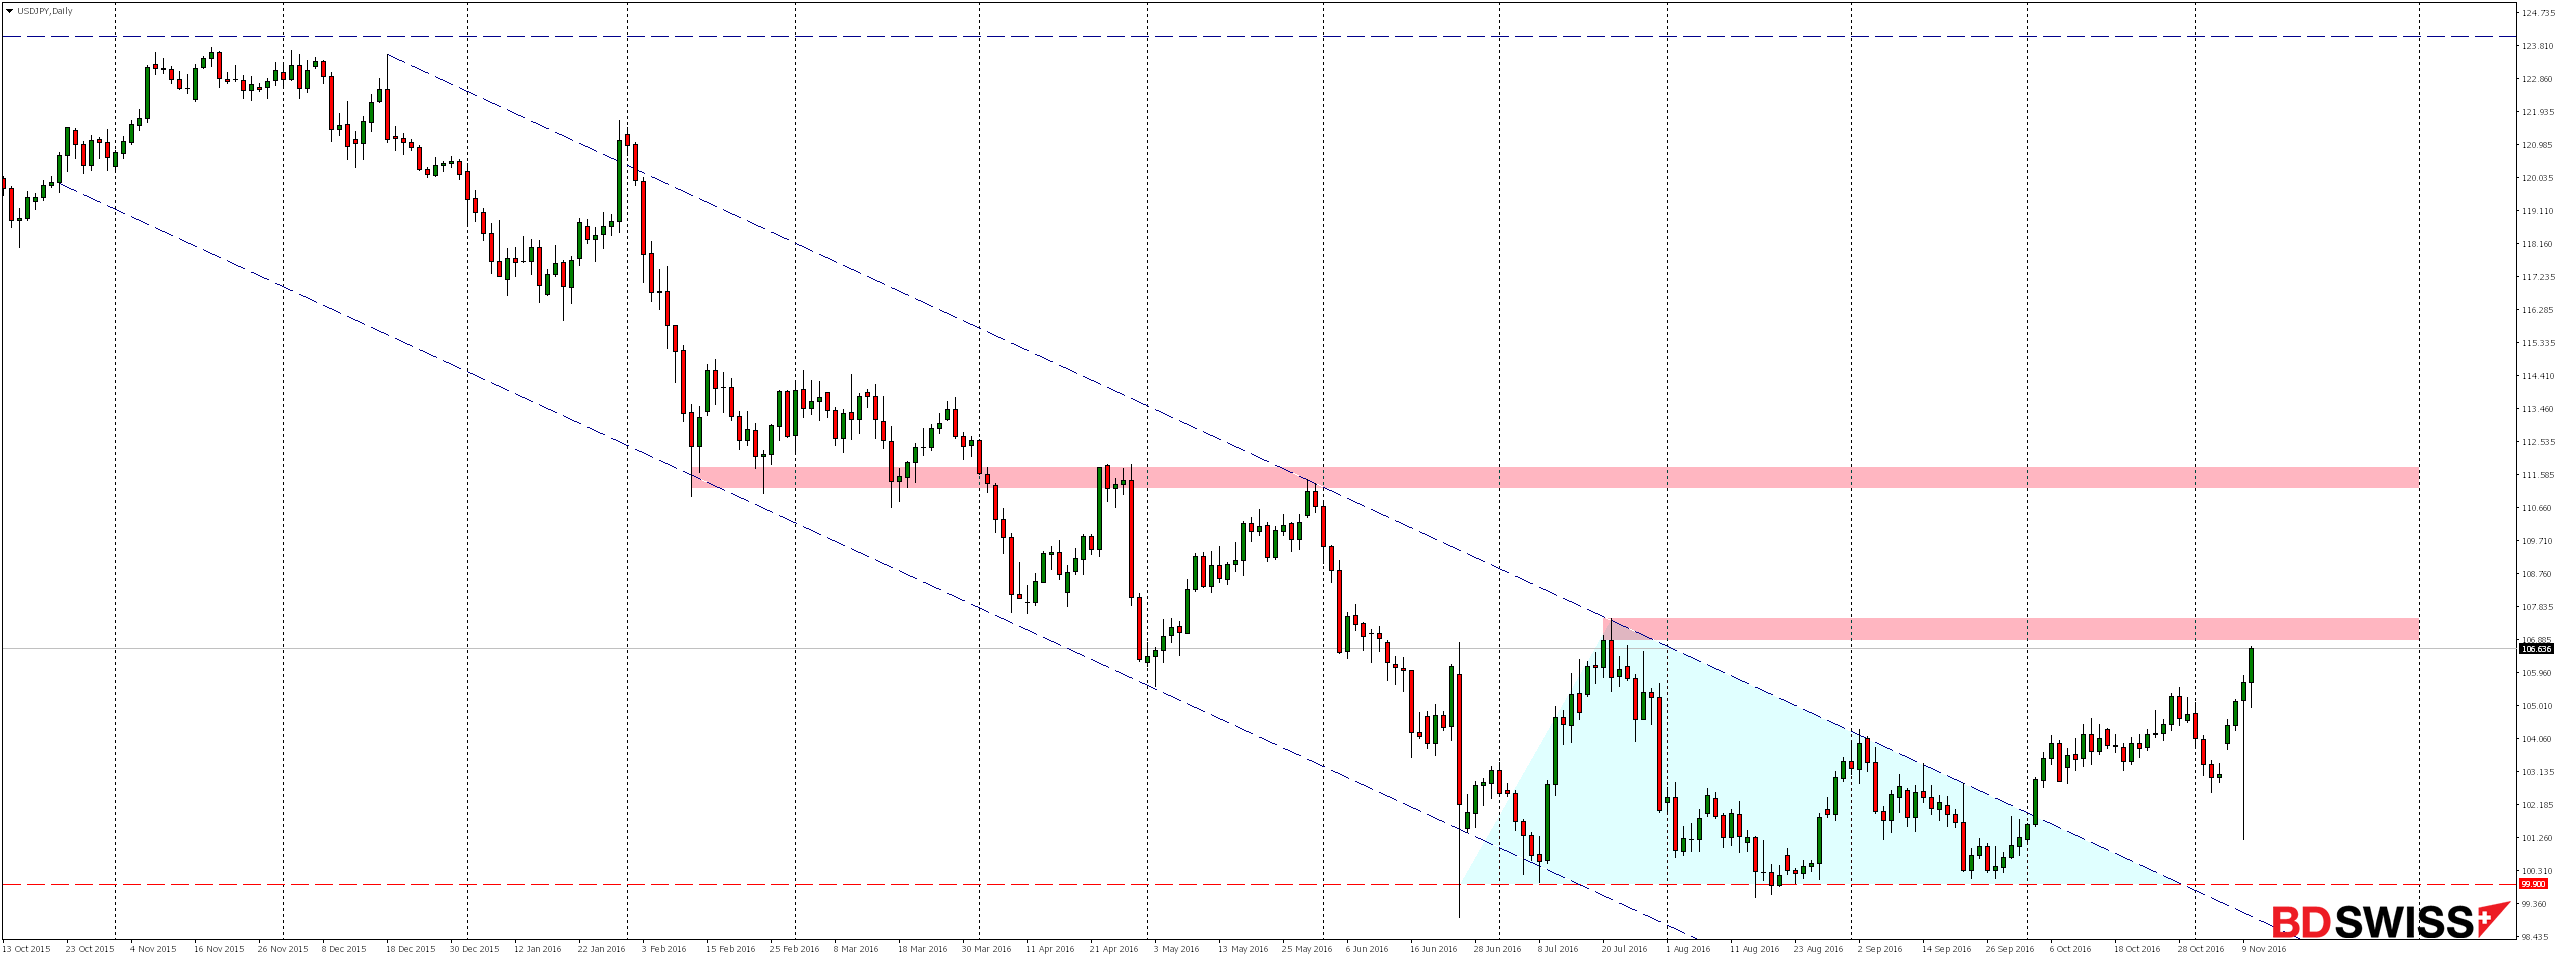
On the daily chart, we see that the 11-month downward trend moves within a channel which only after three atempts with no succes was broken and the support 99.90 was defeated in early October. Currently we are approaching the vicinity of a very important resistance area, where we can expect the emergence of supply response.

At the H4 chart we can see that the last few weeks market was moving side ways. With the results of the first survey of the presidential election in the US, on the night of Tuesday to Wednesday we observed a strong depreciation of the US dollar and the currency pair USDJPY recorded a dynamic decline that reached up to the vicinity of local support 101.73.
After the announcement of the official results and the speech of the new president – Donald Trump, who calmed saying that he intends to be the president of all Americans and called for help, and joint activities not only his supporters but also opponents, the markets very quickly accepted this information as a result of which the situation began to stabilize and we saw equally dynamic growth, due to which the currency pair USDJPY not only returned to the levels before the election but also broke them.

At the H1 chart we can observe very dynamic growth, and if only the market will react to the aforementioned resistance zone, the potential downward correction could reach a level of around 105.80 or further support zone.
Given the strength of growth, there is also likely that the supply will not be able to stop the demand from further increases so easily.

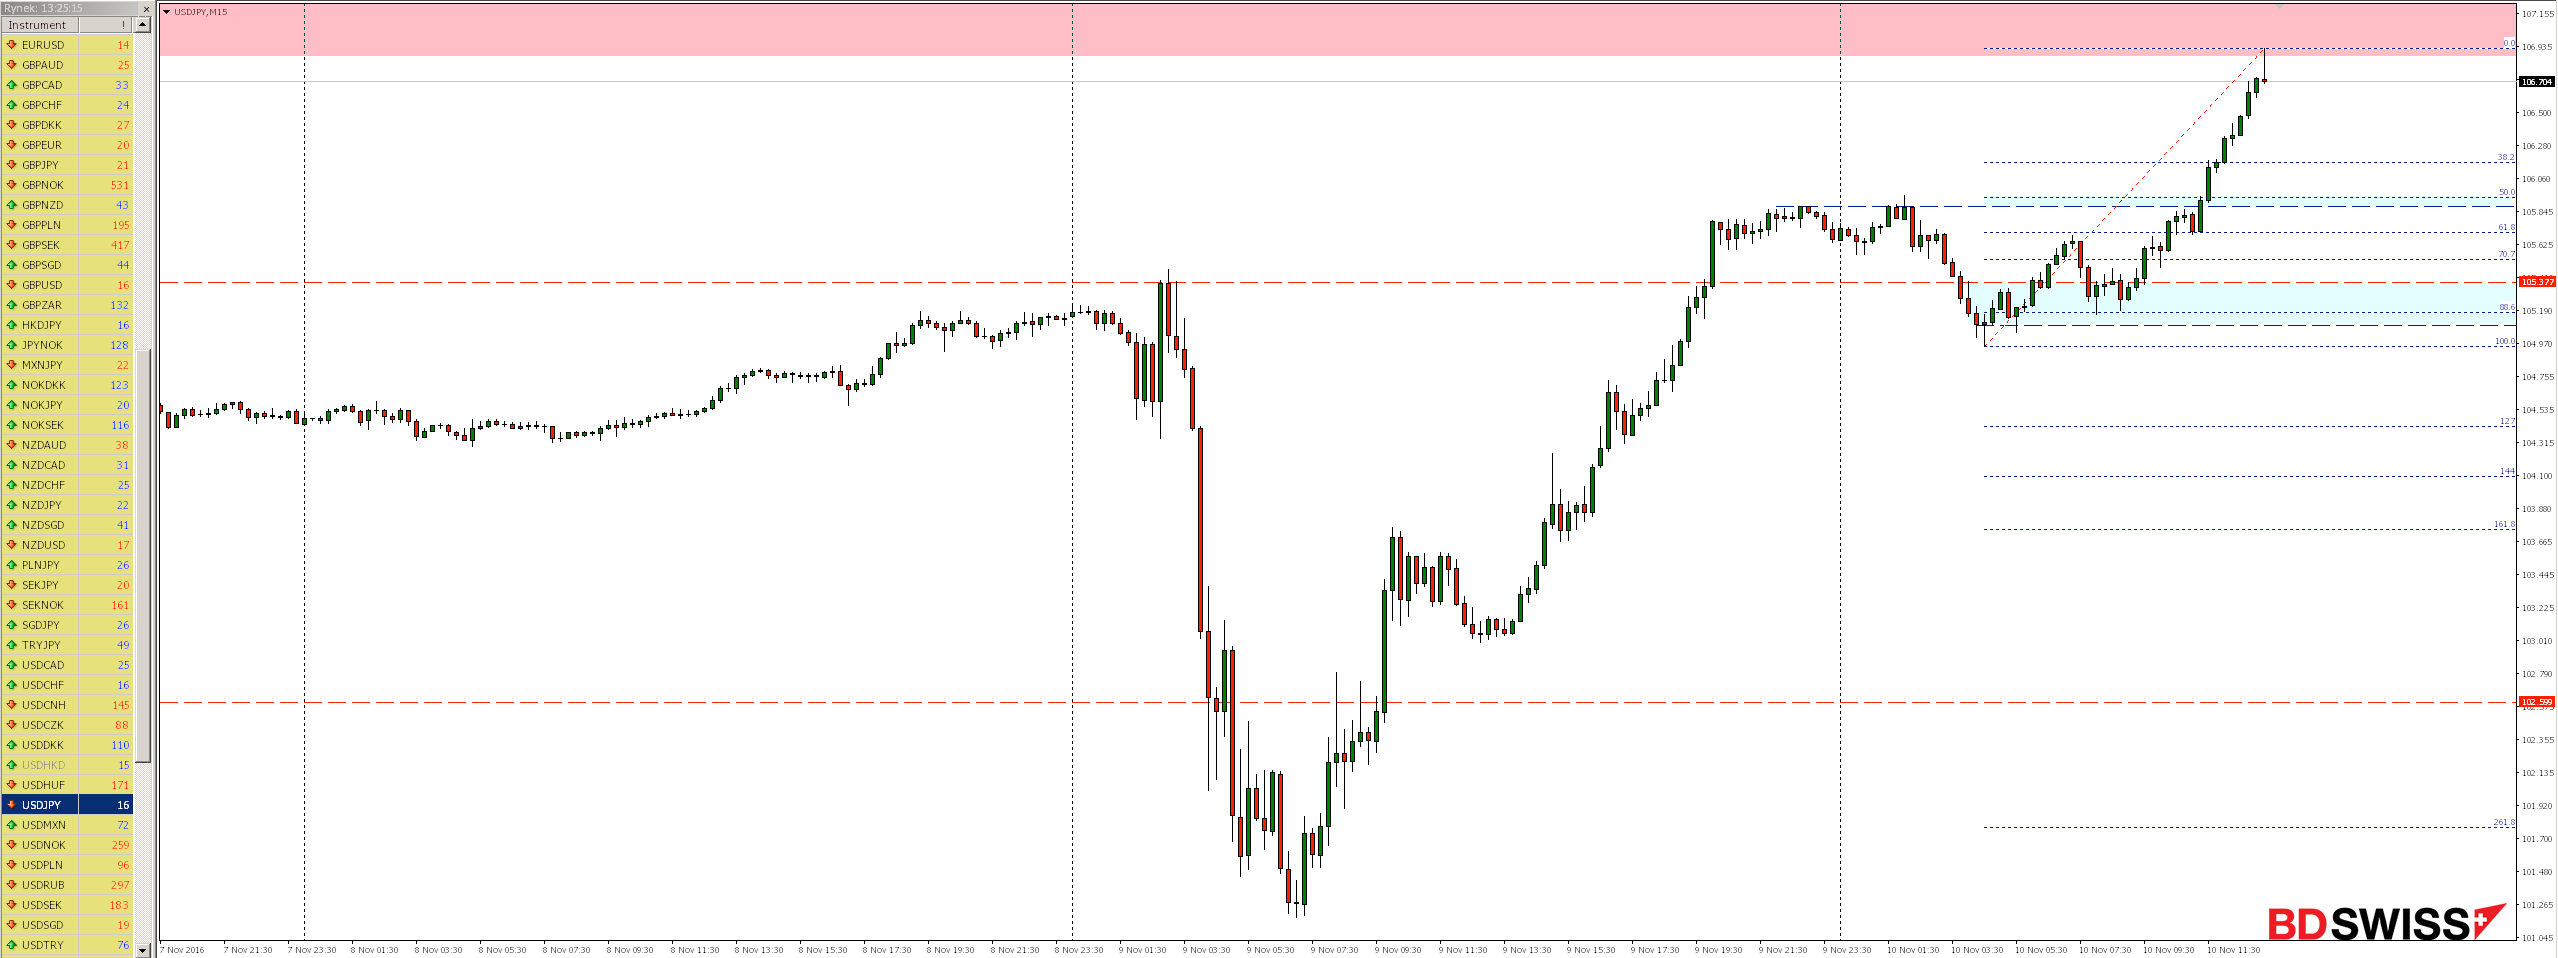
On the M15 chart we see that the potential range of adjustment 105.80 coincides with measuring the 50% Fibonacci correction of today’s gains.
To make an offer to invest Broker BDSwiss and use a low spread, which at the time of the creation of the analysis on USDJPY was 1.6 pips.


