![]()
![]() From Investor to Scalper – series of studies created in cooperation with broker BDSwiss , in which we take a financial instrument and the analysis includes a detailed look at the value from the monthly chart and ending with 5/15 minutes.
From Investor to Scalper – series of studies created in cooperation with broker BDSwiss , in which we take a financial instrument and the analysis includes a detailed look at the value from the monthly chart and ending with 5/15 minutes.
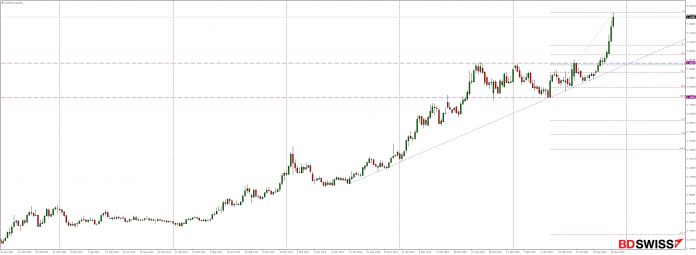
Currency pair USDTRY from the very beginning of their trading moves north. As a result of very dynamic growth supported by, among others, presidential election in the US, market set new highs.
Looking at the weekly chart we see that almost for consecutive period of nine weeks the market moves north gradually increasing the dynamics of growth. Given the fact that we are at historical highs, and no matter how far back in time will look back, we don’t find any historical resistance. It is hard, therefore, to determine a potential turning point.
In accordance with the principle of changing the poles, defeated in October, the level of 3.0660, which until now was a very important resistance should now be tested as support.
Possibility of appearance of a downward correction in the near future is also supported by the fact that the aforementioned level is currently on a very popular area of 61.8% Fibonacci correction otherwise called gold ratio.
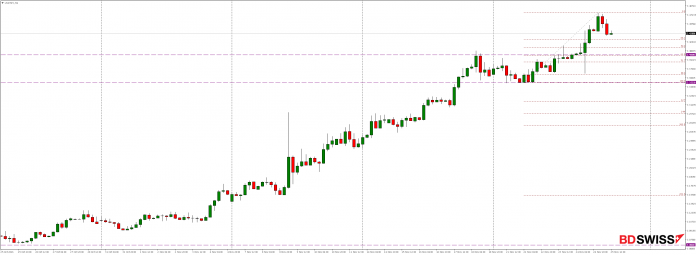
Looking at H4 chart we can see that to consider possibility of changing market sentiment , it would be necessary to create lower low which actually is located at this weeks minimum and support 3.3520. So far more likely is testing located slightly above the level of 3.4008 coinciding with the measuring 61.8% Fibo correction of recent increases.
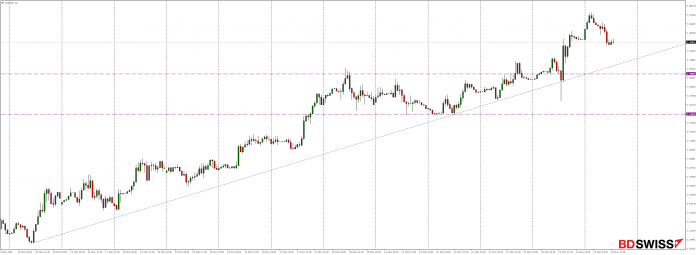
At the chart H1 we can see that on the way to the declines is also the line of upward trend.
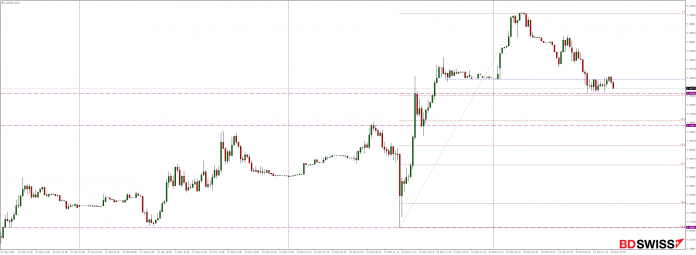
Looking at the chart M15 we can see that today’s declines have already defeated the first local support and it can turn out that in near future they will overcome the level 3.4351 coinciding with the measuring 38.2% Fibo of the ongoing growth of yesterday.


 Review")


