Last week’s NZD/CAD quotations freed themselves from more than 2 months of consolidation, where the price moved between 0.8920 – 0.9090. Where can the exchange rate go now?
As can be seen in the daily chart below, last Tuesday a pin bar was formed indicating the potential to correct part of the upward movement after breaking the resistance of the range around 0.9090. This is what happened, and the price returned to the confluence of support created by the previous resistance and the average channel EMA 10/20.
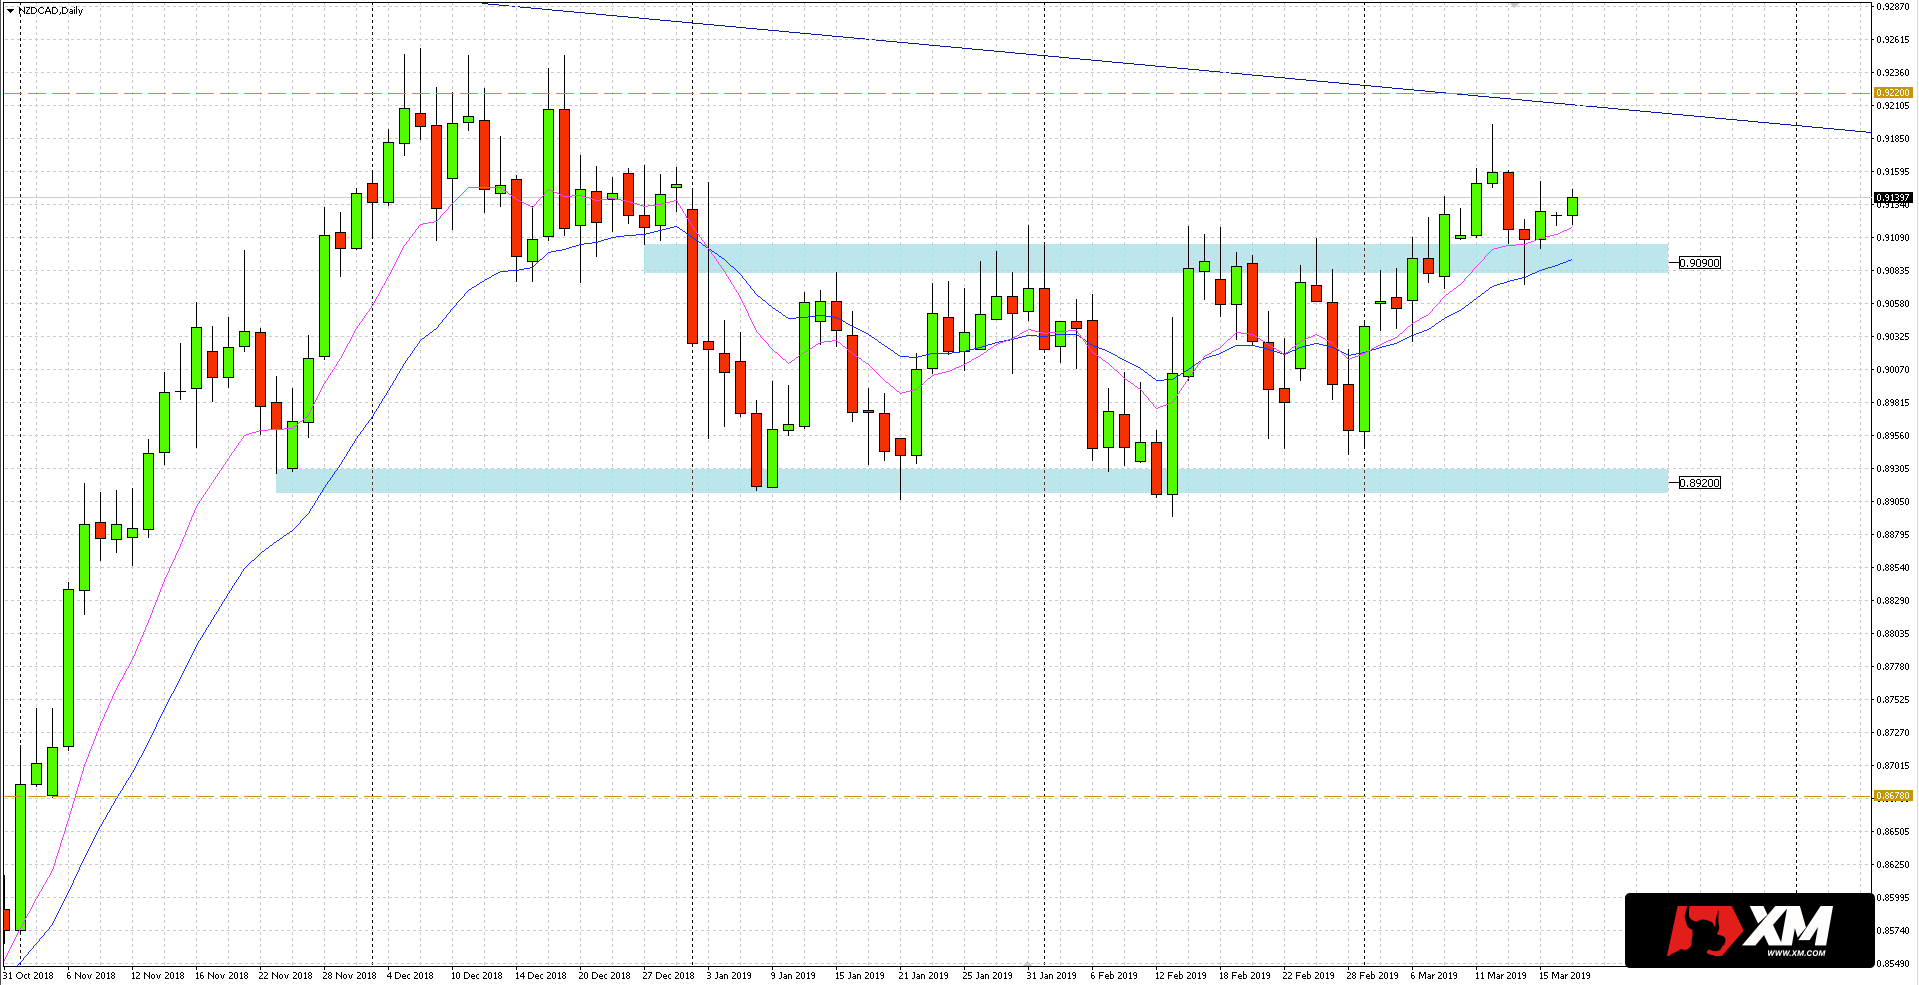 The support zone was successfully tested with the price action formation (also a pin bar) on Thursday, after which the NZDCAD course was strengthening the next day. If the upward movement continues after the breakout, quotations may reach the last peak at 0.9196. However, the area at 0.9220 will be much more significant resistance, including the horizontal level and the downward trend line running from the top in 2016.
Alternatively, the return of quotations on the day’s closing to the range will challenge the pro-growth short-term attitude on this currency pair.


 Review")


