For the last 6 weeks NZDUSD has been moving in a strong downward trend. I wrote about this pair in the summary of the last week. On Friday, for the first time in a long time, there was a sign of a slowdown in drops, the daily candle took the form of a pin bar.
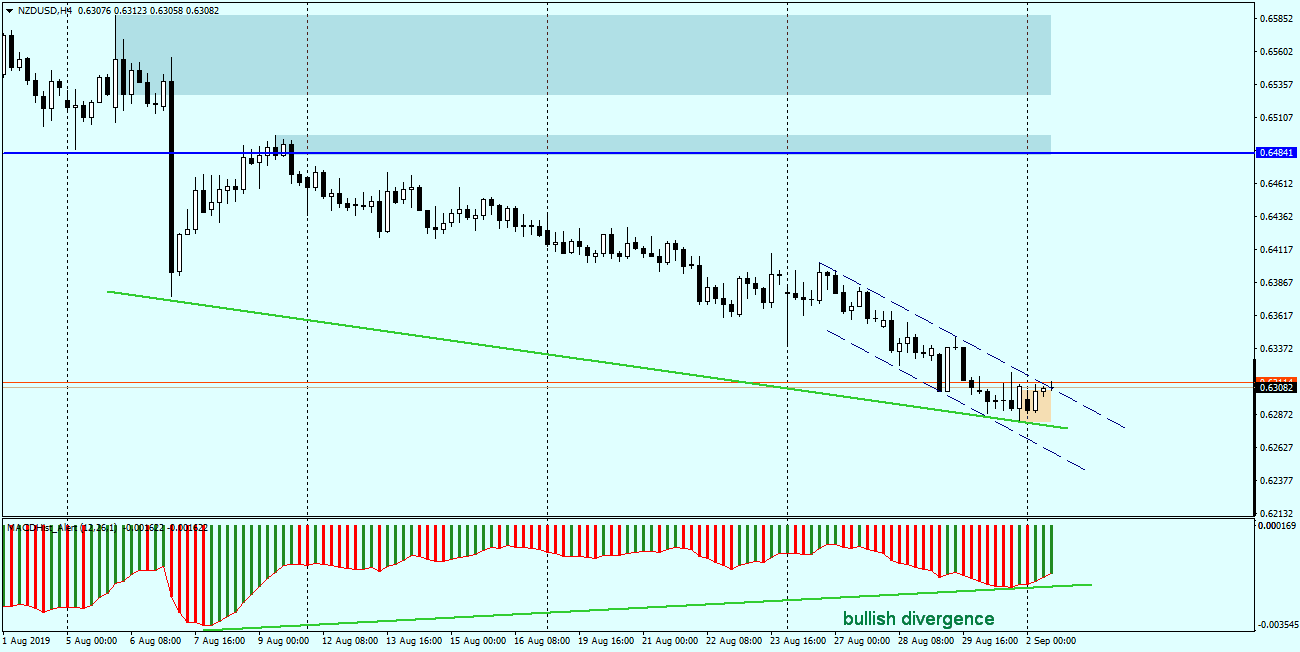
In the chart above (H4) we have a upward divergence, which started on Friday afternoon during the American session, and today’s Asian session confirmed its continuation.
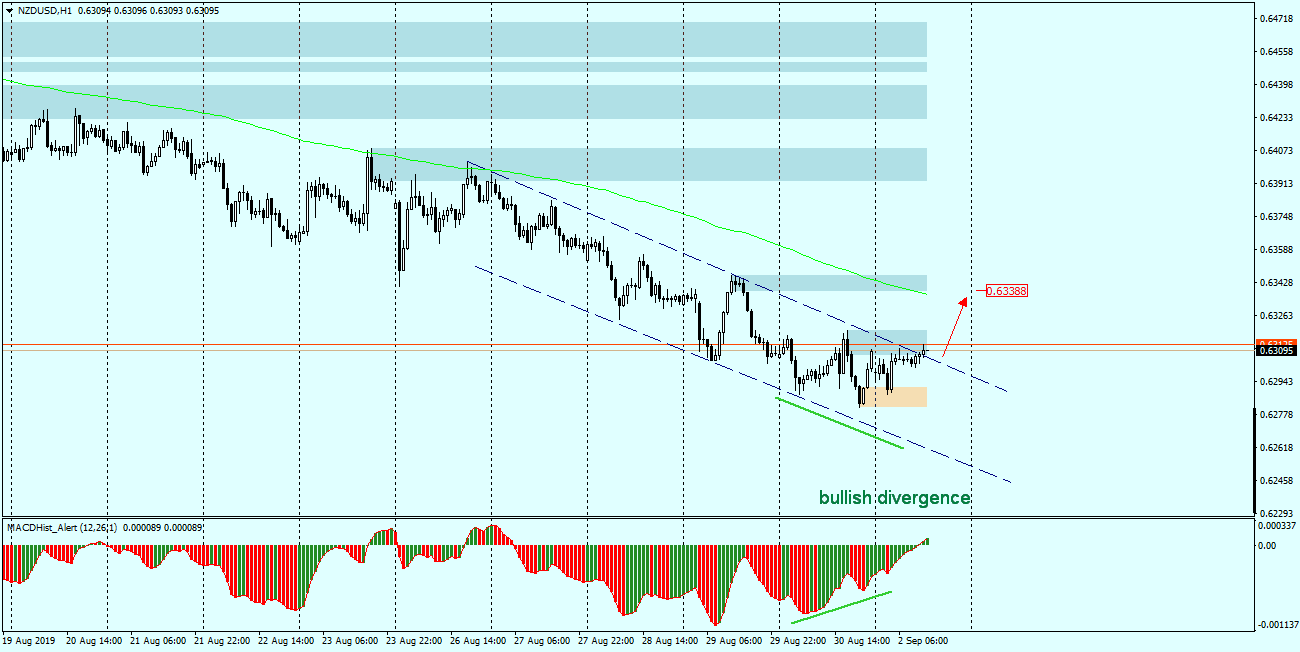
If you look at chart H1, you will notice that the price is breaking the downward channel. And here, too, we have upward divergence in price/MACD. If the upward movement continues, the nearest supply zone of 0.6340 may be the first target of the current correction.


 Review")


