The NZD/USD currency pair has recently overcome a significant zone of support confluence. The quotations marked a new low, and now the correction has begun, which may bring opportunities for trading.
As can be seen in the daily chart below, the exchange rate of the New Zealand dollar against USD has dropped this month to both horizontal support (0.6720) and upward trend lines starting from the 2018 low.
After the breaking the support, the exchange rate went down until the middle of last week and then a rebound occurred, where the buyers managed to partially make up for the losses caused by the last bearish impulse.
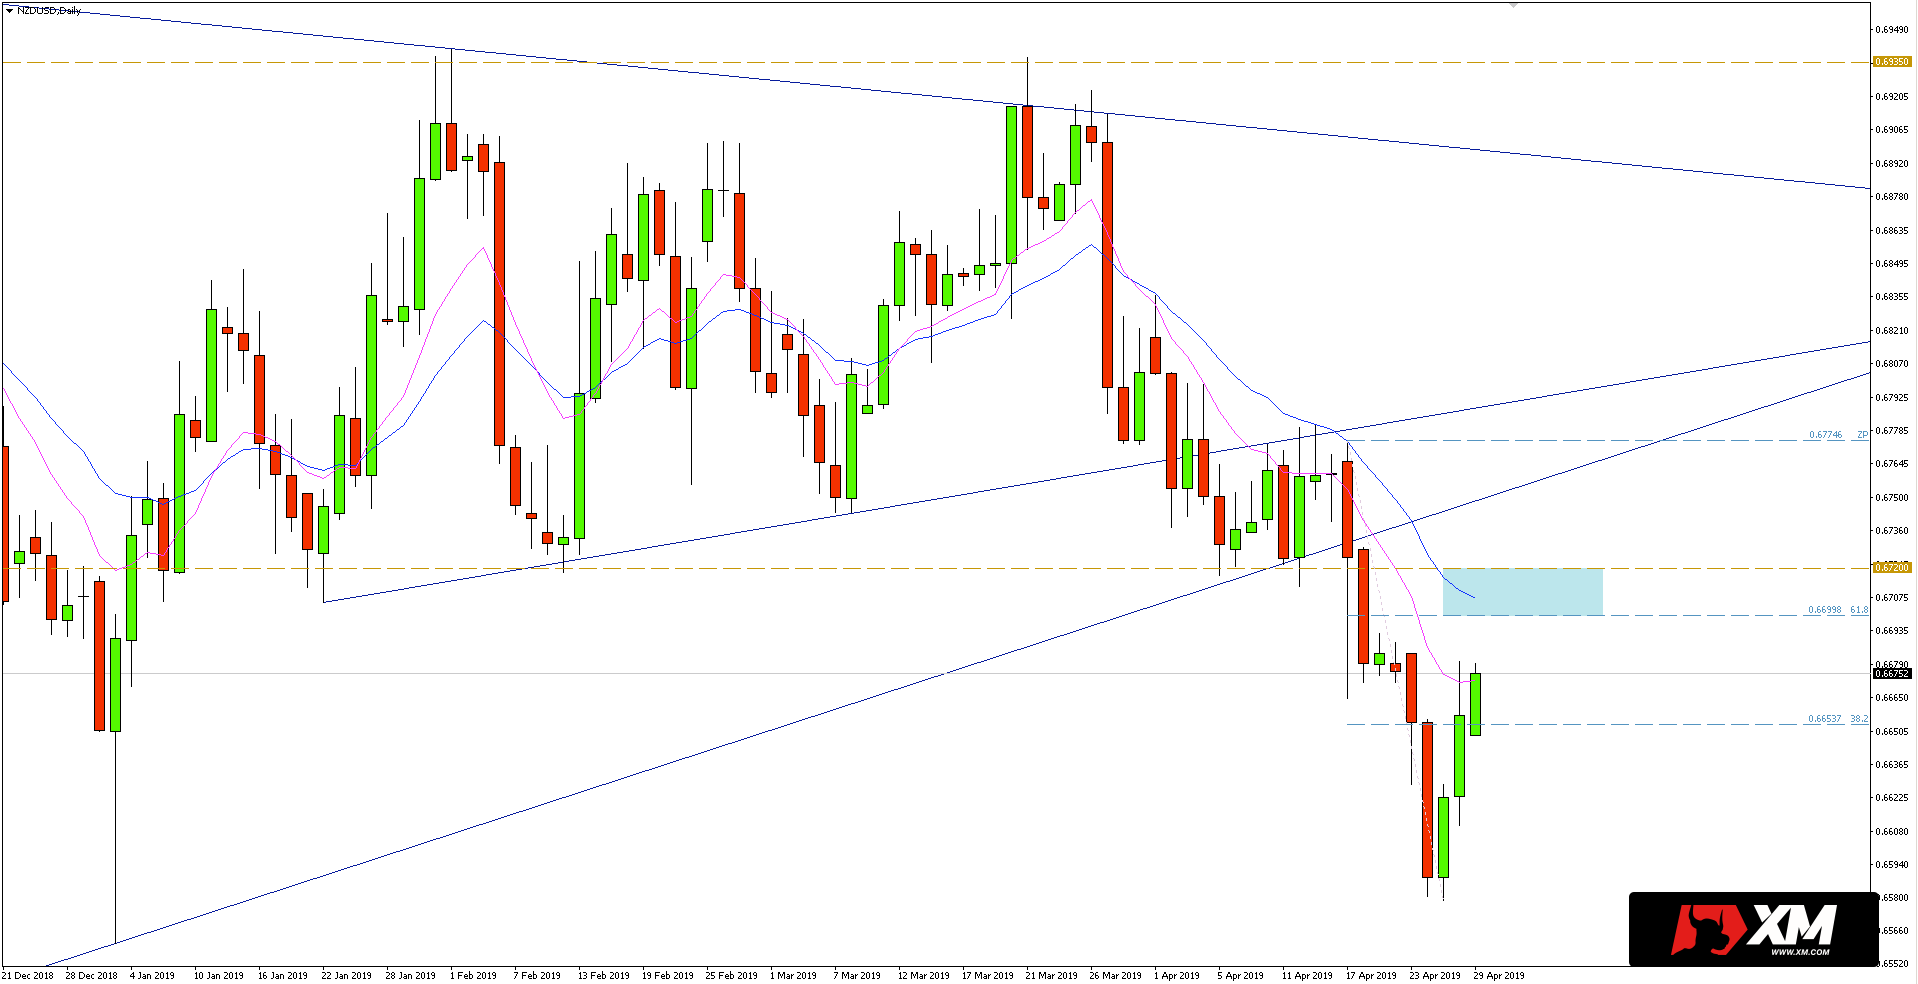
The correction is continued also at the beginning of this week, so the question remains where can we look for the end of it and where can we join the downward trend. The nearest significant resistance seems to range from 0.6700 (the elimination of 61.8% of the last downward impulse) to the former support at 0.6720. In addition, there is currently a 20-day EMA in this zone which can act as a dynamic resistance.
The appearance of a sell signal in this zone could provide an opportunity to join the trend. The nearest target would then be in the low at 0.6580.


 Review")


