USDJPY – since the beginning of the year, the quotations of the pair have been moving in an upward trend and since the memorable flash crash, when the price fell to 104.70, it has already recovered 770p, quoting the 24th of April at the maximum of this year at 112.40.
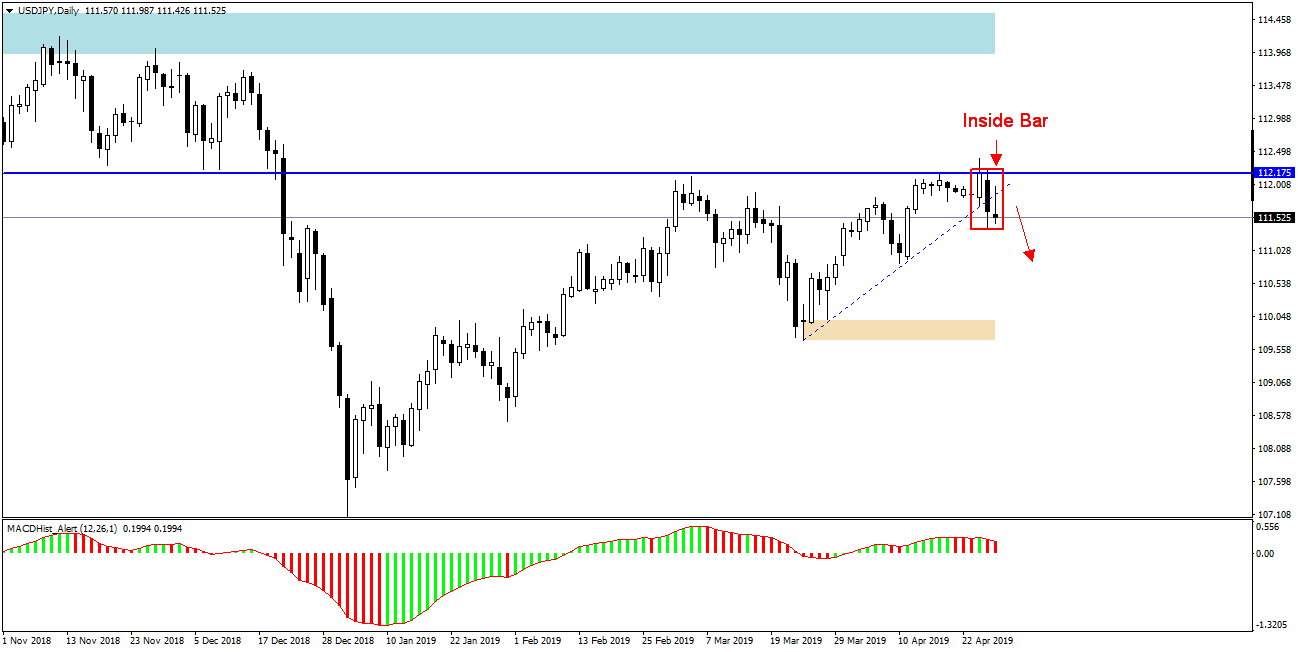
This is the second time this year the price exceeds 112.17, but every time it quickly returns below this level. Last week the pair ended up forming Inside Bar formation. On the MACD there is a downward divergence.
If you look at the H4 chart below you will notice that:
– after reaching the maximum this year’s quotations went backwards indicating a rejection of 112.17
– On Friday, a candle with upper long wick appeared which indicates a successful re-test of the defeated local upward trend line .

Taking into account the ongoing downward divergence on the MACD in the daily chart, we can expect to see decreases towards the nearest demand zone at 111.00 with a high probability.
Only successful defeat of 112.17 can negate the downward scenario. It should also be taken into account that in the next 10 days in Japan there are holidays on the stock exchange and banks will be closed, which may significantly affect liquidity in these days and increase volatility.


