The New Zealand dollar (NZD), a popular currency from the antipodes, has been systematically losing to the American dollar (USD) for almost 2 years. Only this year the declines amounted to nearly 650p. On the weekly chart the bullish engulfing formation was formed (red rectangle).
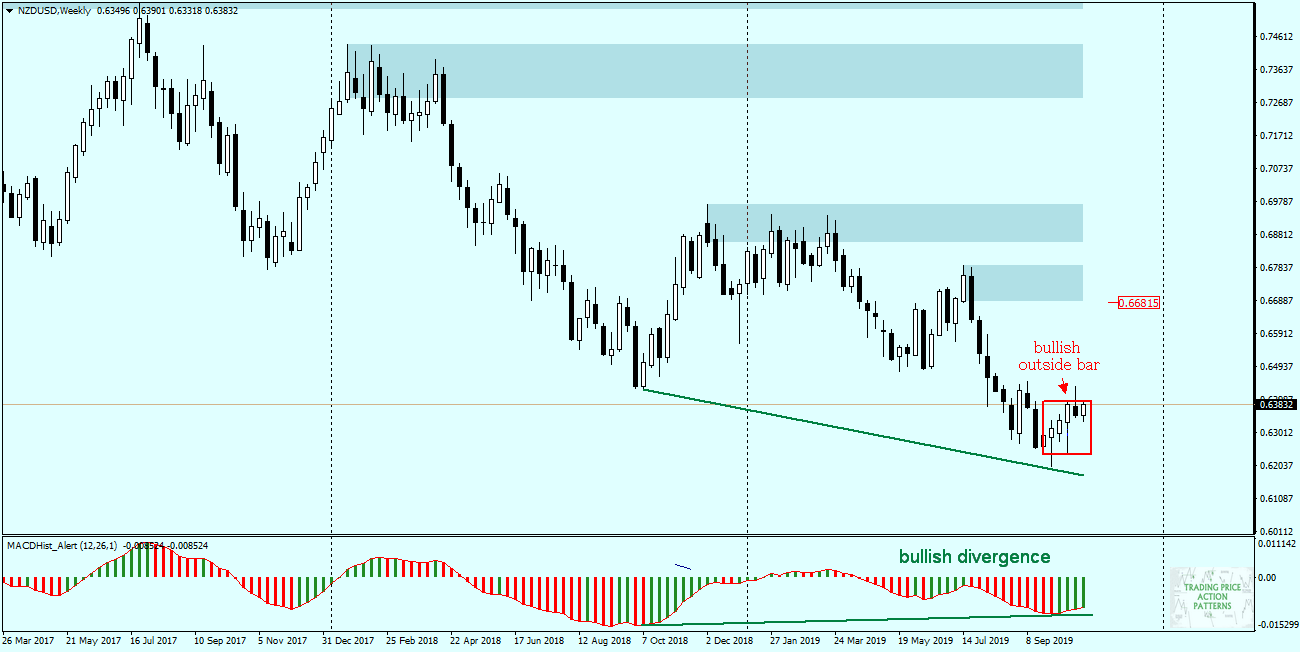
The creation of this formation was accompanied by the appearance of bullish divergence, MACD set a minimum and began to grow.
XM offers traders minimum deposits from $5 and security through CySEC, ASIC and FCA licenses. Trade with a broker with 10 years of market tradition and more than 2.5 million clients worldwide

When we look at the daily chart, we can see that here we also have the bullish engulfing formation (blue rectangle). The formation was created by today’s daily candle. Undoubtedly, such a bullish attitude towards this pair was influenced by today’s decisions of the FED to reduce the interest rates in the USA. The signal for further increases will be the effective breaking of the upper limit of both Outside Bars at the level of 0.6390.
The likely first demand target is the nearest support/resistance level of 0.6480.
If, however, the market decides to hit the bottom of the daily OB, an upward trend is less likely.
In our Facebook group, which you can join anytime: https://www.facebook.com/groups/328412937935363/ you will find 5 simple strategies on which my trading is based. There, every day we post fresh analyses of currency pairs and commodities


 Review")


