The end of the week has been marked by the publication of important macroeconomic data from the USA. On Wednesday, the market was waiting for the FED’s decision on setting interest rates, and the 0.25p cut expected by the market turned out to be a fact.
On Friday, data from the US labour market was published, which turned out to be better than expected by 30,000 new jobs in the non-agricultural sector, which initially strengthened the dollar in relation to other currencies, but an hour after the publication, the dollar started to weaken and at the end of the session it was on minus.
This week I analysed two pairs of USDCHF and NZDUSD. In both cases I based my analysis on the price action formations – Inside Bar and bullish engulfing.
USDCHF 28.10-02.11.2019
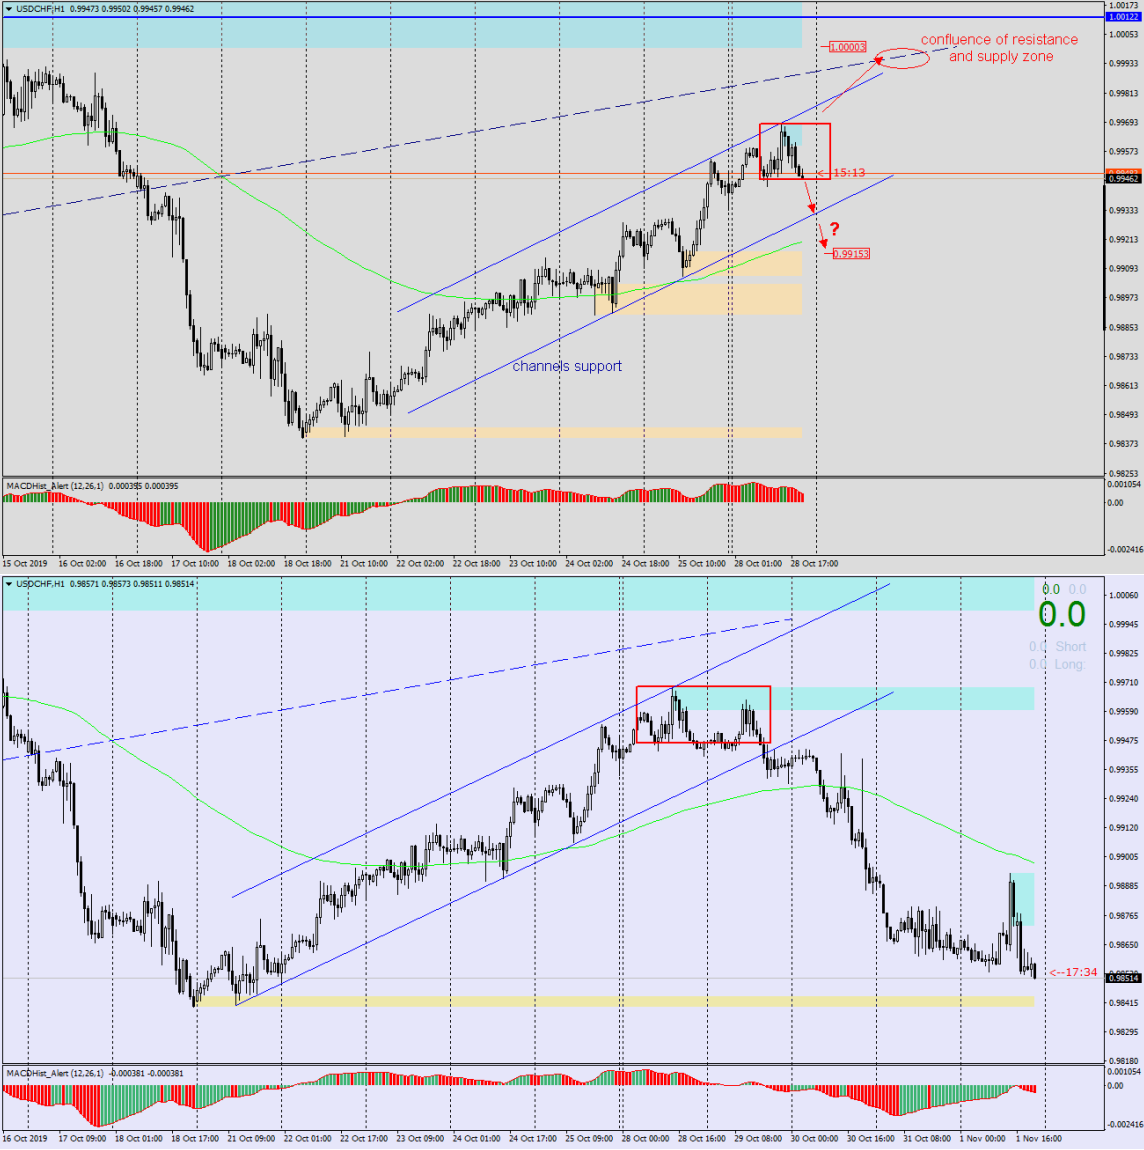
In the analysis from Monday: “USDCHF – is this the end of the growth correction? I wrote so -“: “On chart H1 we can see that the correction of the recent declines took the form of a growth channel. If the exit from the IB (from chart H4) takes place through the bottom, the goal may be the support of the channel, and after its breaking, the nearest demand zone starting at 0.9915. The MACD is also in a downward phase.“
The attached chart shows that the answer to the question in the title of the analysis is yes. The predictions came true and the price was moving until the end of the week in the direction in which it left the Inside Bar. Admittedly, at the beginning there was an attempt to break through the top, but the price after reaching the supply zone (blue) turned south, breaking through the IB bottom.
XM offers traders minimum deposits from $5 and security through CySEC, ASIC and FCA licenses. Trade with a broker with 10 years of market tradition and more than 2.5 million clients worldwide
NZDUSD 30.10-03.11.2019
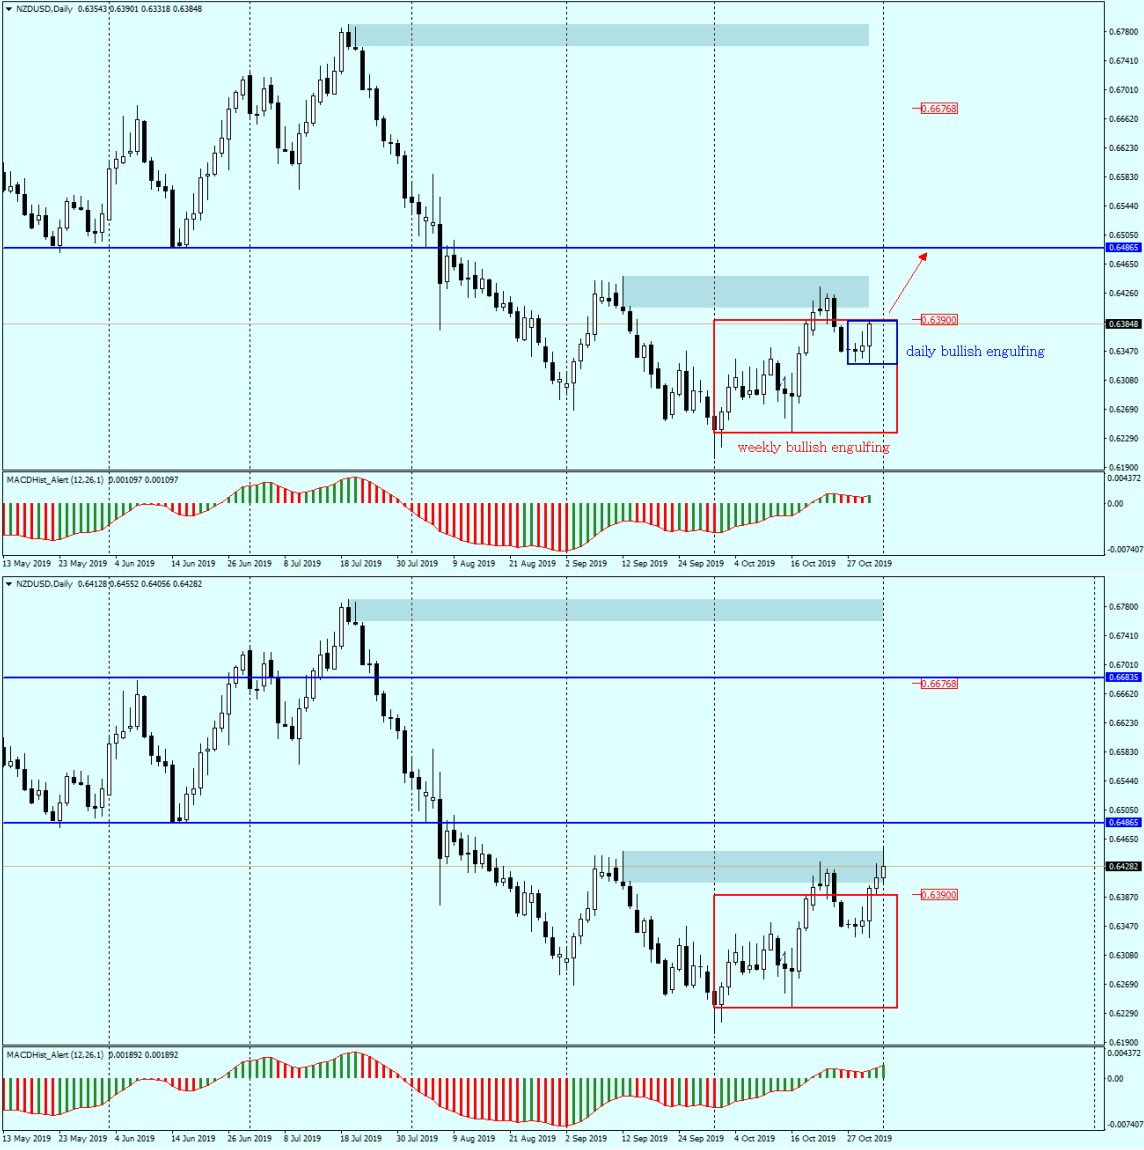
The second analysis of this week was: “NZDUSD – will kiwi bloom again?”, and as you can see on the diagrams attached (above), NZD, popularly called “kiwi”, is growing nicely and is heading for the nearest S/R level.
I wrote this: -” When we look at the daily chart, we can see that here we also have the bullish engulfing formation (blue rectangle). The formation was created by today’s daily candle. Undoubtedly, such a bullish attitude towards this pair was influenced by today’s decisions of the FED to reduce the interest rates in the USA. The signal for further increases will be the effective breaking of the upper limit of both Outside Bars at the level of 0.6390.“
The likely first demand target is the nearest support/resistance level of 0.6480.
The likely demand target is the nearest level of support/resistance 0.6480″.
The 0.6390 level was defeated during the Asian session, and during the London session it was re-tested and by the end of the week the NZDUSD exchange rate was quite definitely climbing up to 0.6450. Next week also promises to be bullish, but we can expect one more re-test of the 0.6390 level.
In our Facebook group, which you can join anytime: https://www.facebook.com/groups/328412937935363/ you will find 5 simple strategies on which my trading is based. There, every day we post fresh analyses of currency pairs and commodities


 Review")


