 The New Zealand dollar in relation to the US dollar (NZD/USD) set the minimum on 15 March this year at 0.5470. Since then, it has been moving in an upward trend and after overcoming 1500p, the pair today set the maximum of this year at 0.6966.
Correction on the ‘kiwi’ inevitable?
After this year’s maximum was set on the opening of the New York session, in the afternoon, the exchange rate began to fall and today’s daily candle has completely covered the previous one, creating a bearish engulfing pattern – in the chart, a red rectangle marks the range of the formation.
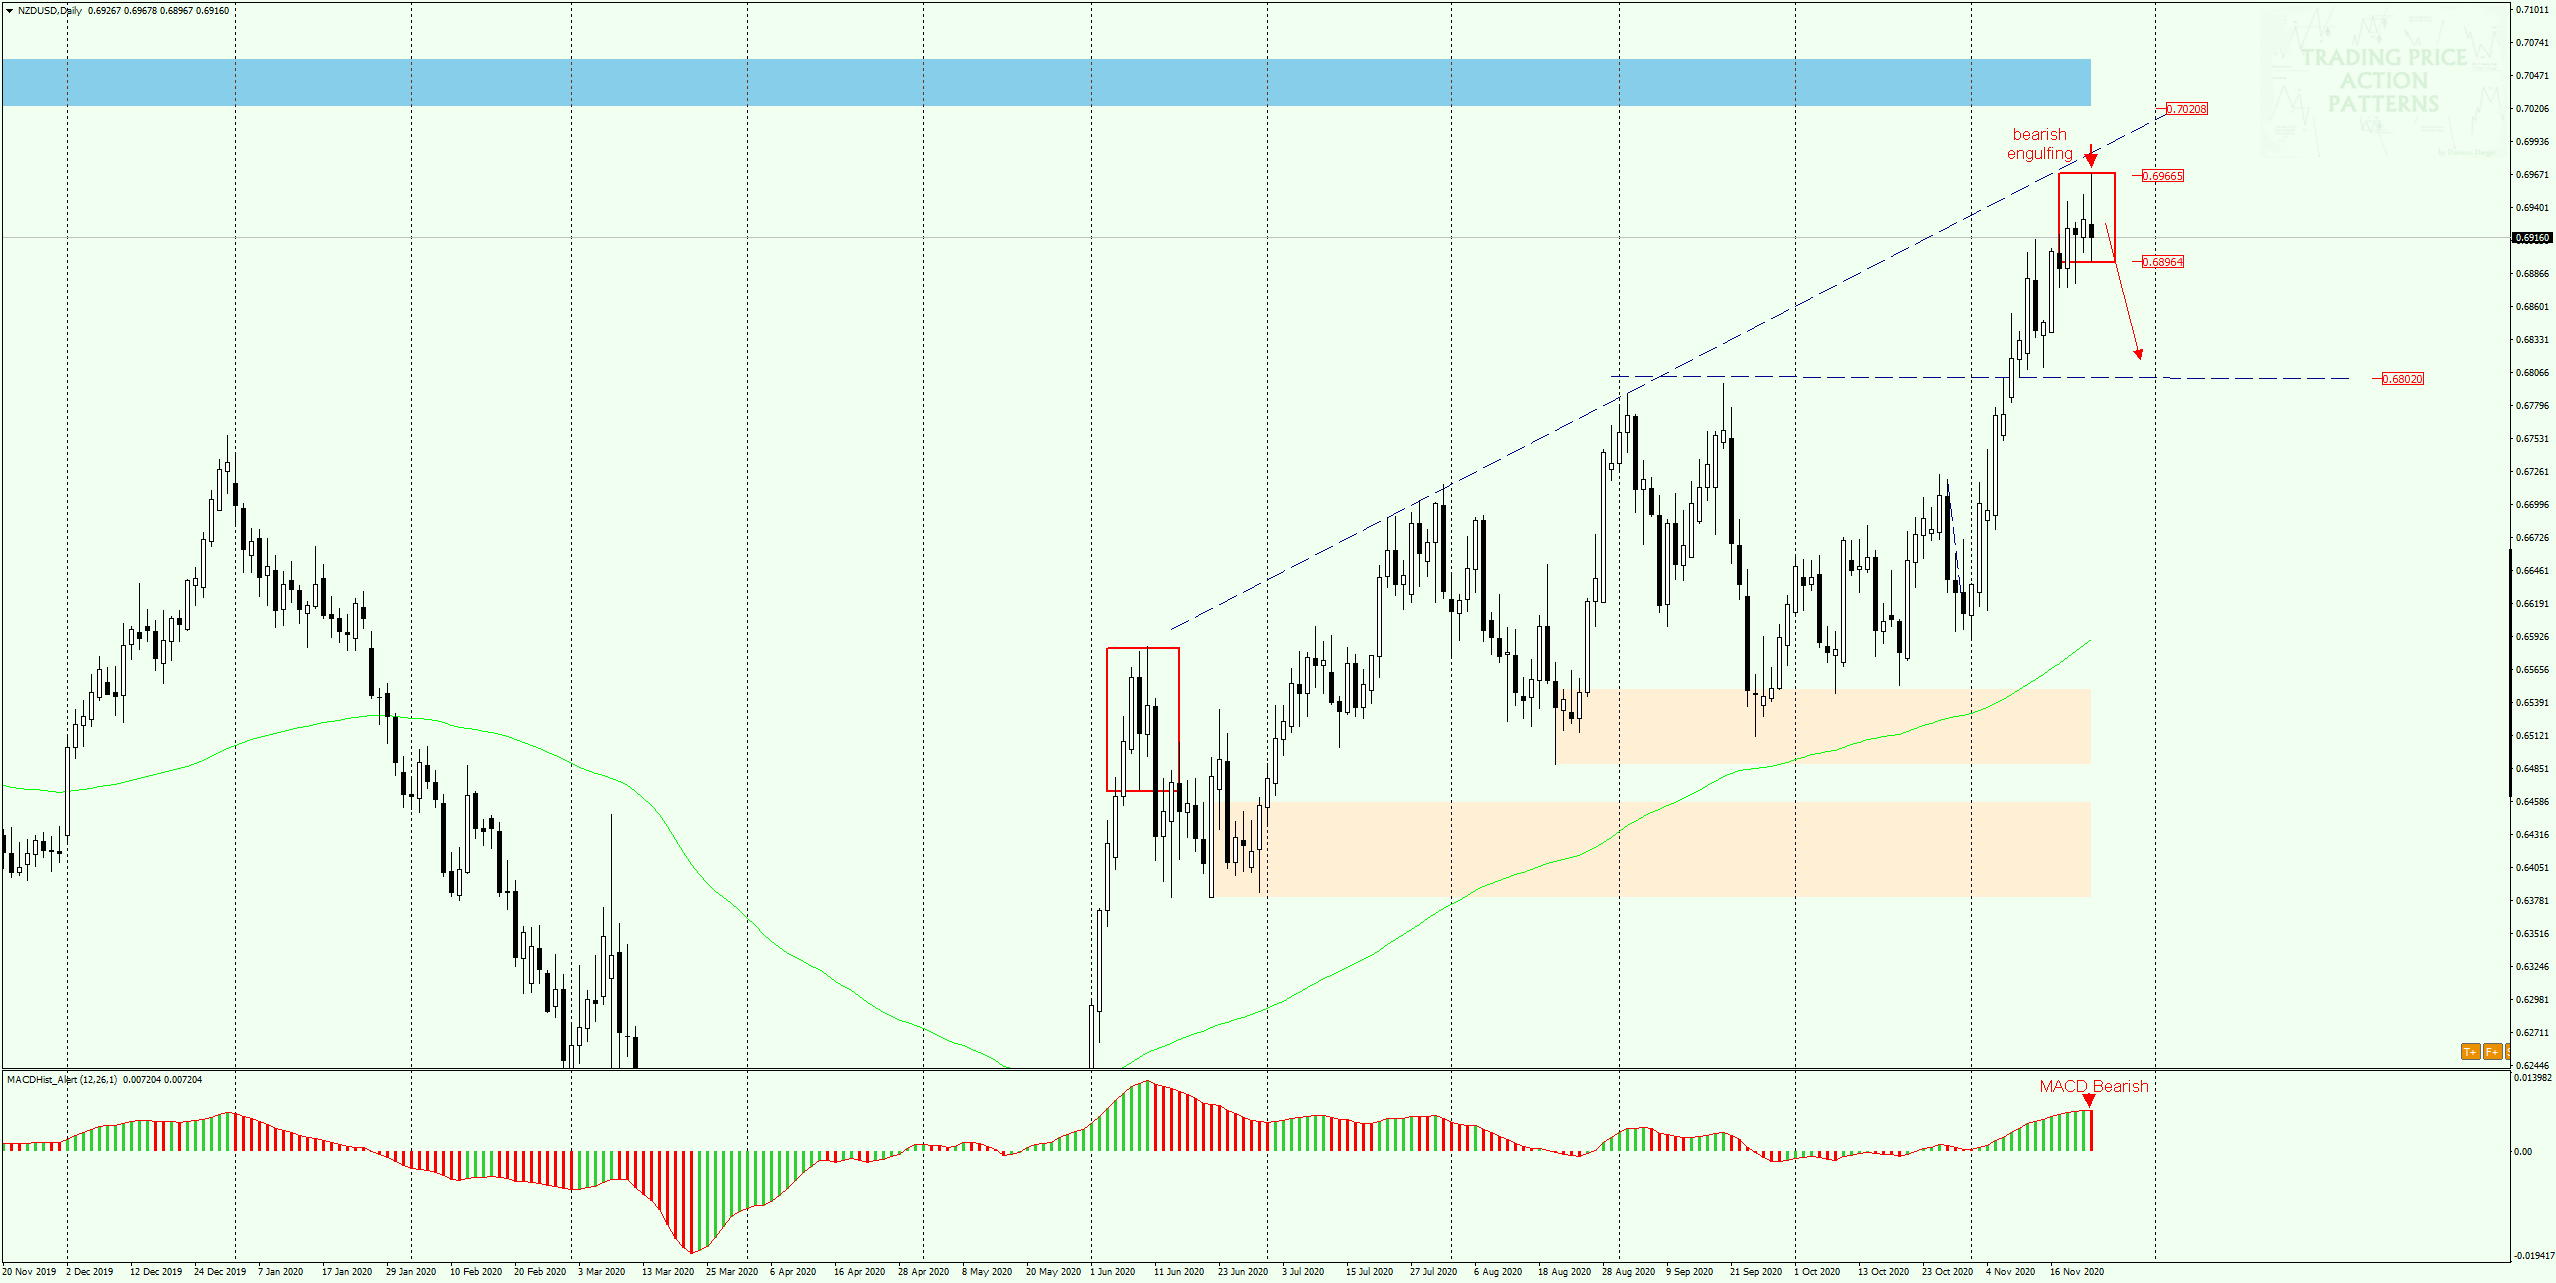
The MACD oscillator after a 3 weeks of increases set a maximum and today it has entered a downward phase, on the histogram there is a lower bar.
On the H4 chart we can draw a local upward trend line (dashed blue), which overcoming can speed up the declines initiated today towards the lower limit of the engulfing pattern.
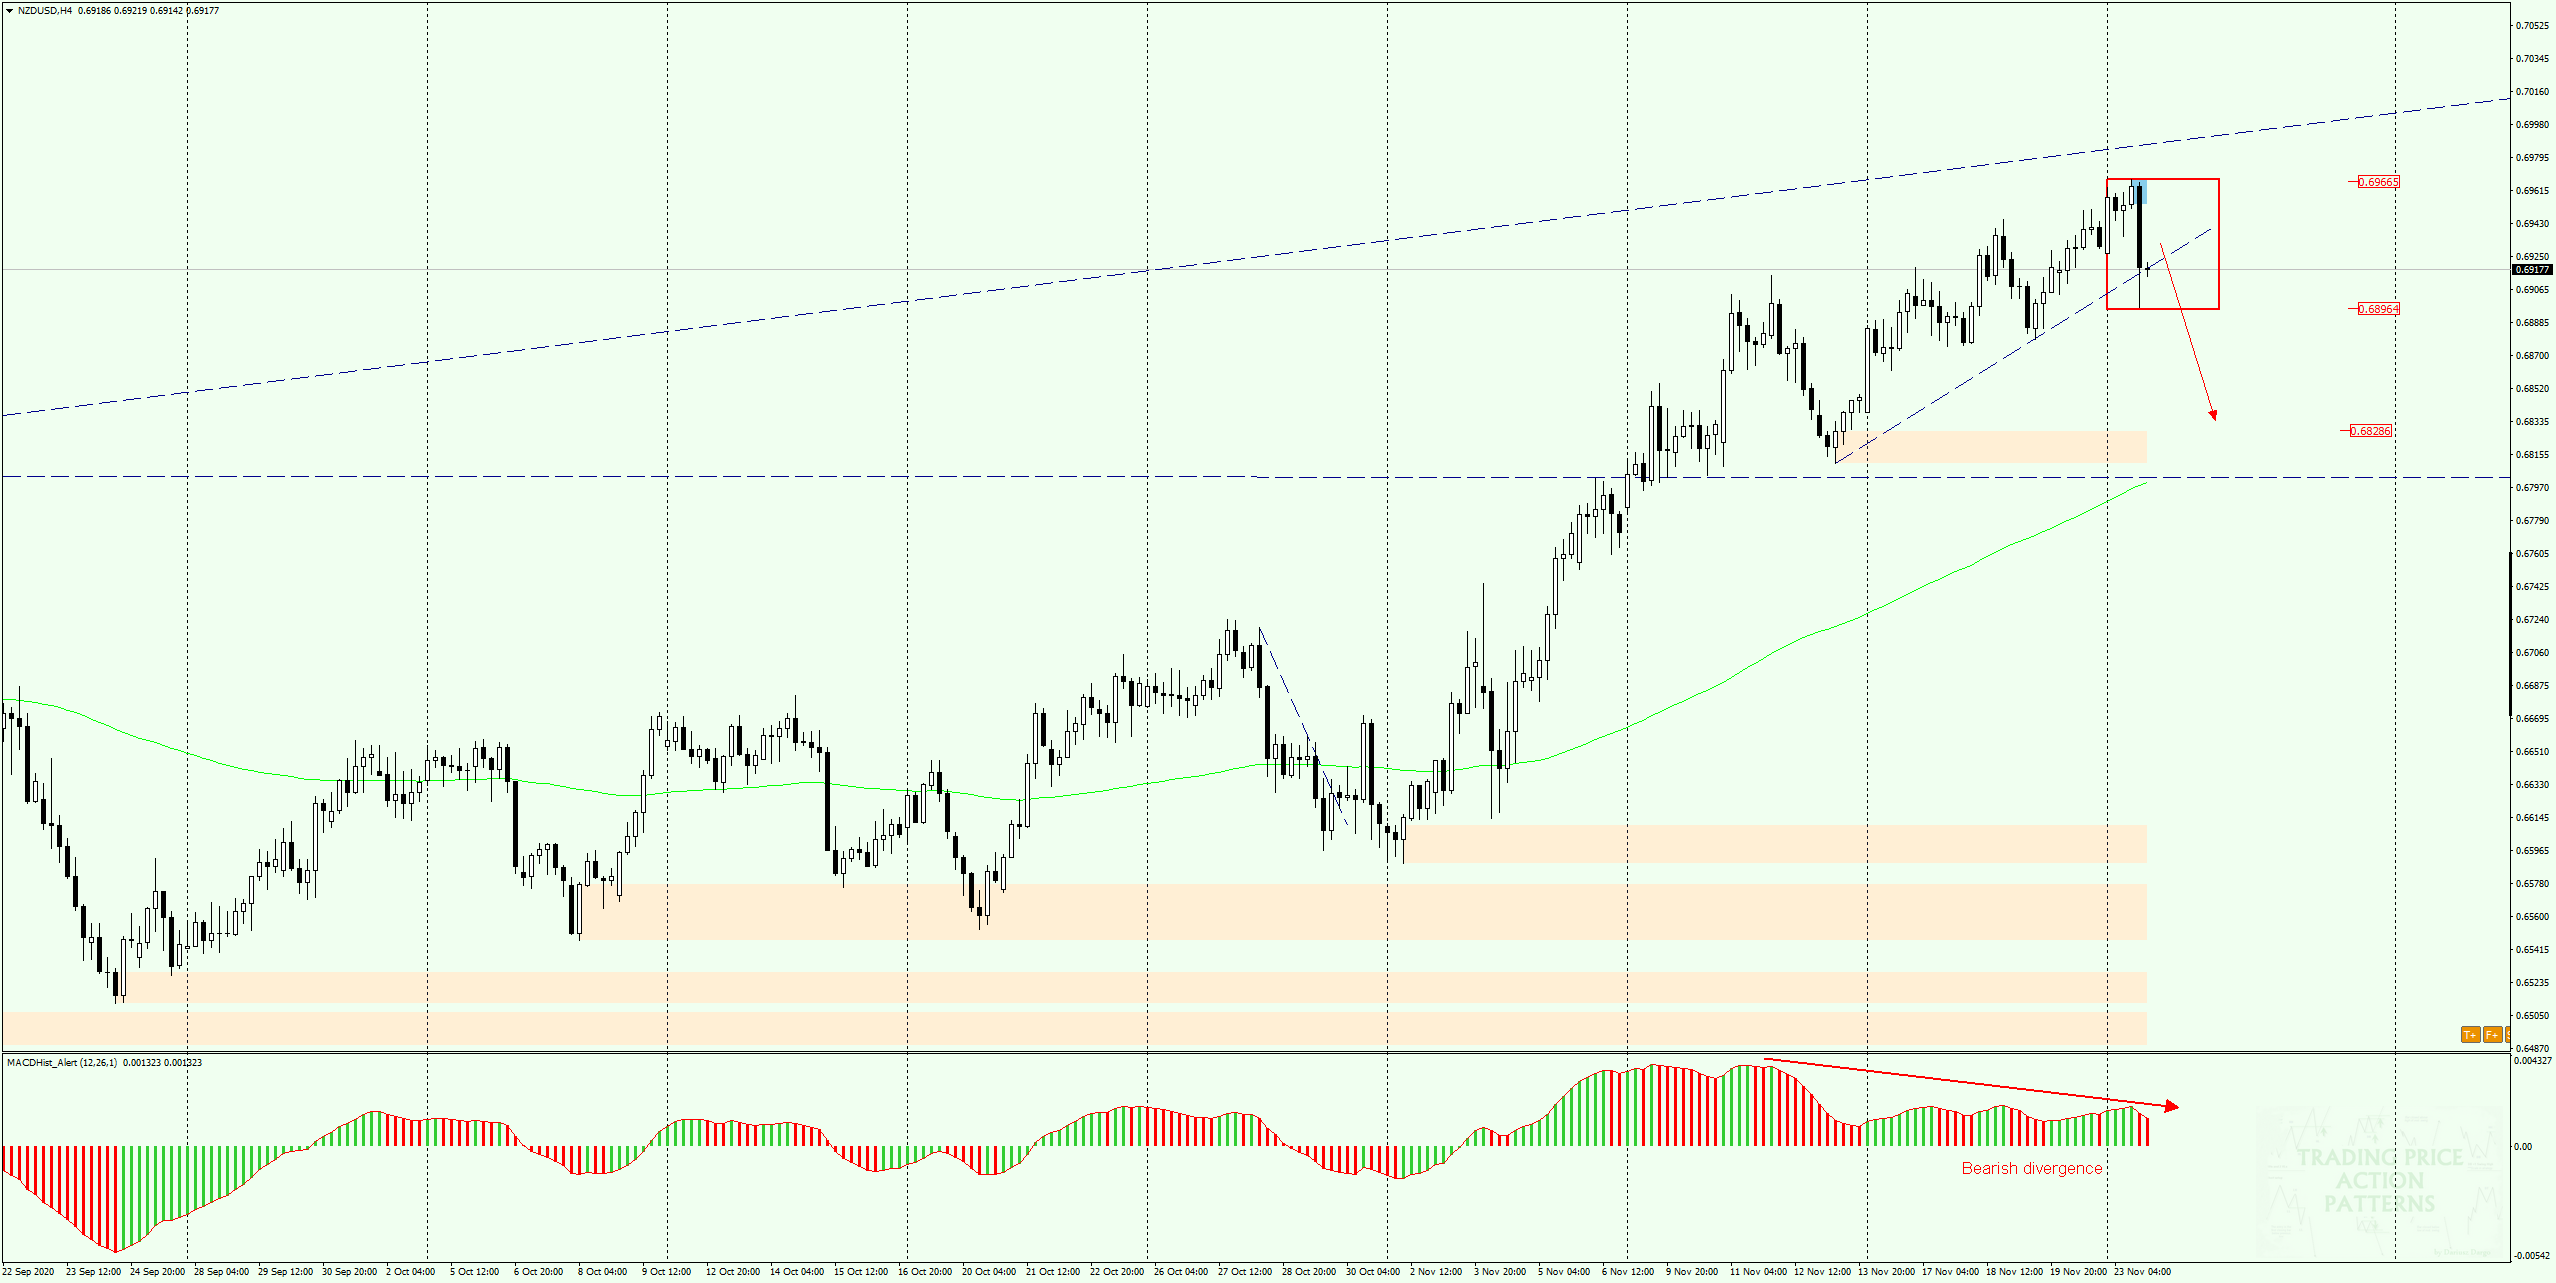
If the bottom of the formation is broken and the MACD continues to fall, the resulting bearish divergence will confirm the beginning of the downward correction on this currency pair. First target can be the nearest demand zone at 0.6830.
I also recommend this stuff:
Trading with PA+MACD, or how to increase the probability of winning
ongoing analysis https://t.me/TradewithDargo
In our Facebook group, which you can join anytime: https://www.facebook.com/groups/328412937935363/ you will find 5 simple strategies on which my trading is based. There, every day we post fresh analyses of currency pairs and commodities. You can also visit my channel where I post my trading ideas: https://t.me/TradewithDargo


 Review")


