The setup overview for EMA Rainbow Strategy is a daily collection of analyzes of potential trades based on this strategy. Detailed description of the strategy can be found under this link. The cycle will last exactly two weeks. After this period, on Saturday, October 7, I will publish a summary of the statistics of this strategy and will report whether or not during these two weeks tested strategy was profitable.
As announced earlier, on the same day, I will also present another strategy that I will test for another two weeks. In this way I will try to test as many investment strategies as possible to find the best and most effective.
On GBPUSD, only from the beginning of the session we had 3 signals to open a position. Two of them indicated signal to open CALL option and one to open PUT option. All three signals proved to be effective and gave the opportunity to generate profit. The red arrows on the graph show signal candles, while the coloured rectangles mark interesting for us candles drawn from opening until the option expire time. According to the assumptions of the EMA Rainbow strategy this period is three times longer than the observed interval. Another signal may appear after next correction and retest of violet average moving average (EMA14).

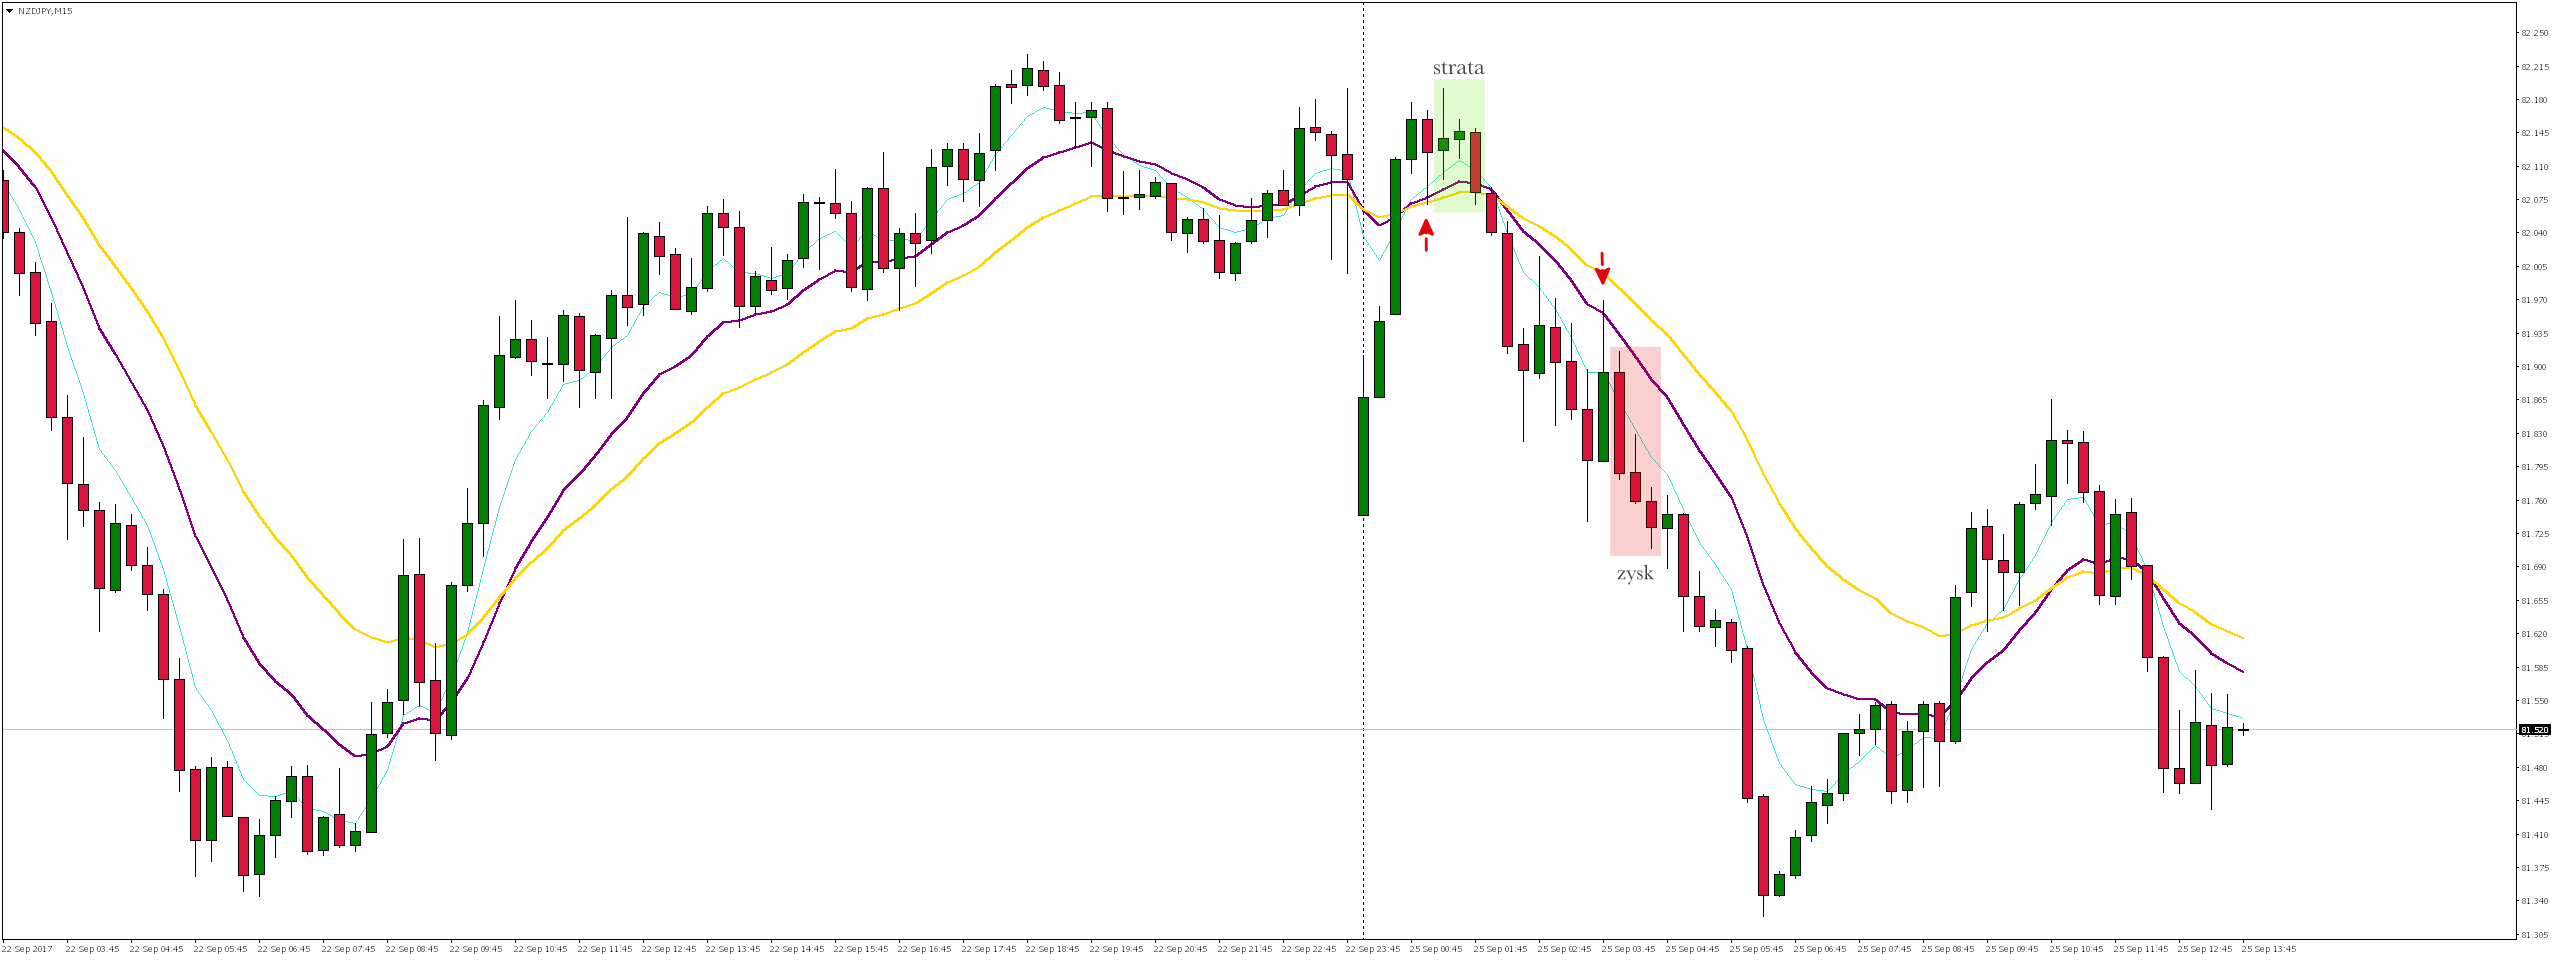
Two signals from the NZDJPY currency pair have so far generated only one profitable. If we re-test the moving average EMA14 in the nearest future, we might consider opening PUT option with an option expiration time of = 45 minutes.
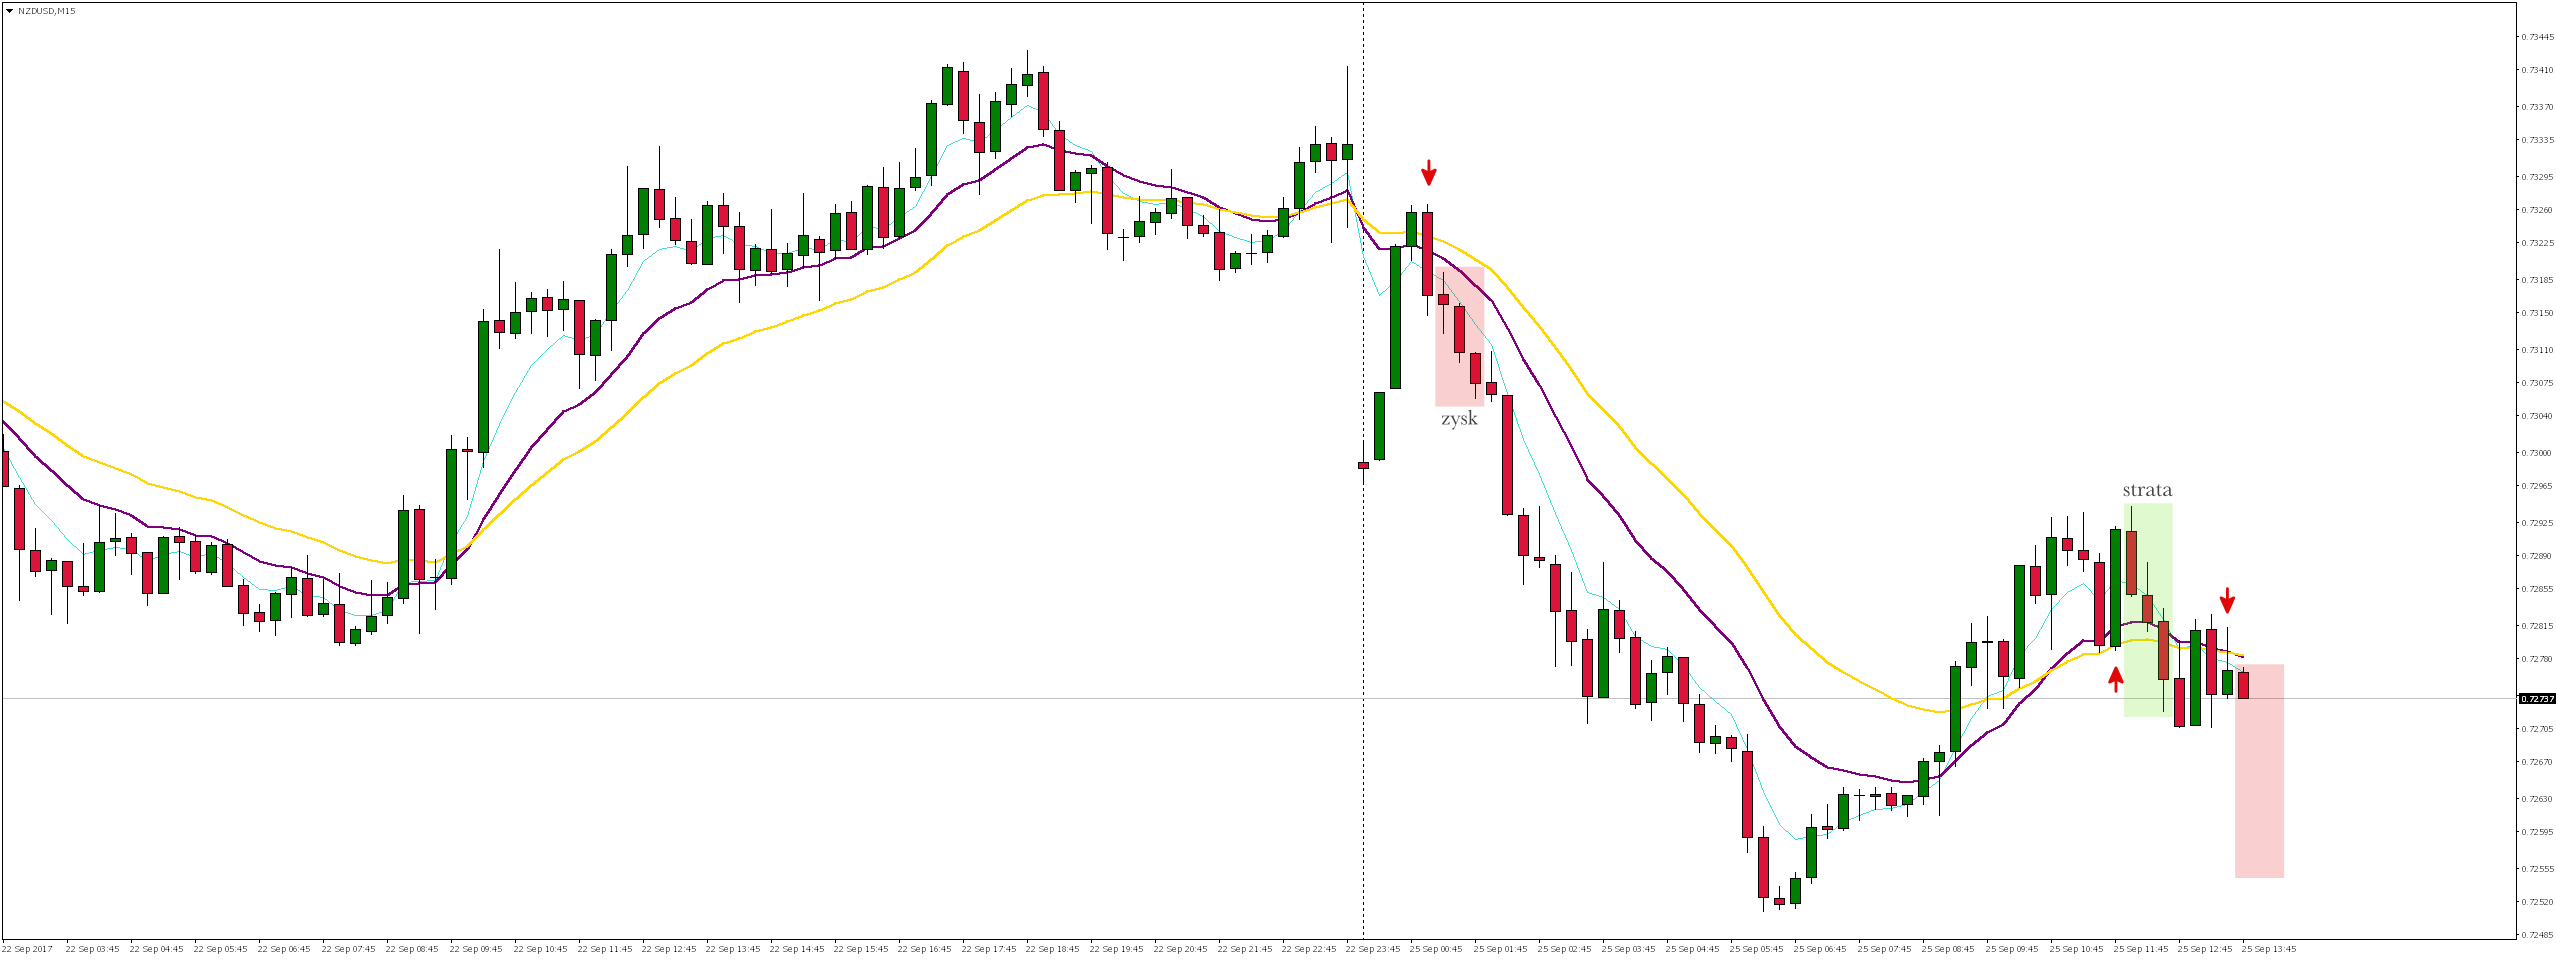
The NZDUSD currency pair gave 3 trading signals so far. One of them ended up making a profit, the other losing, and the third one is in tact. If in the next 3 candles the price will remain at the current or lower level, this will be another profitable trade.
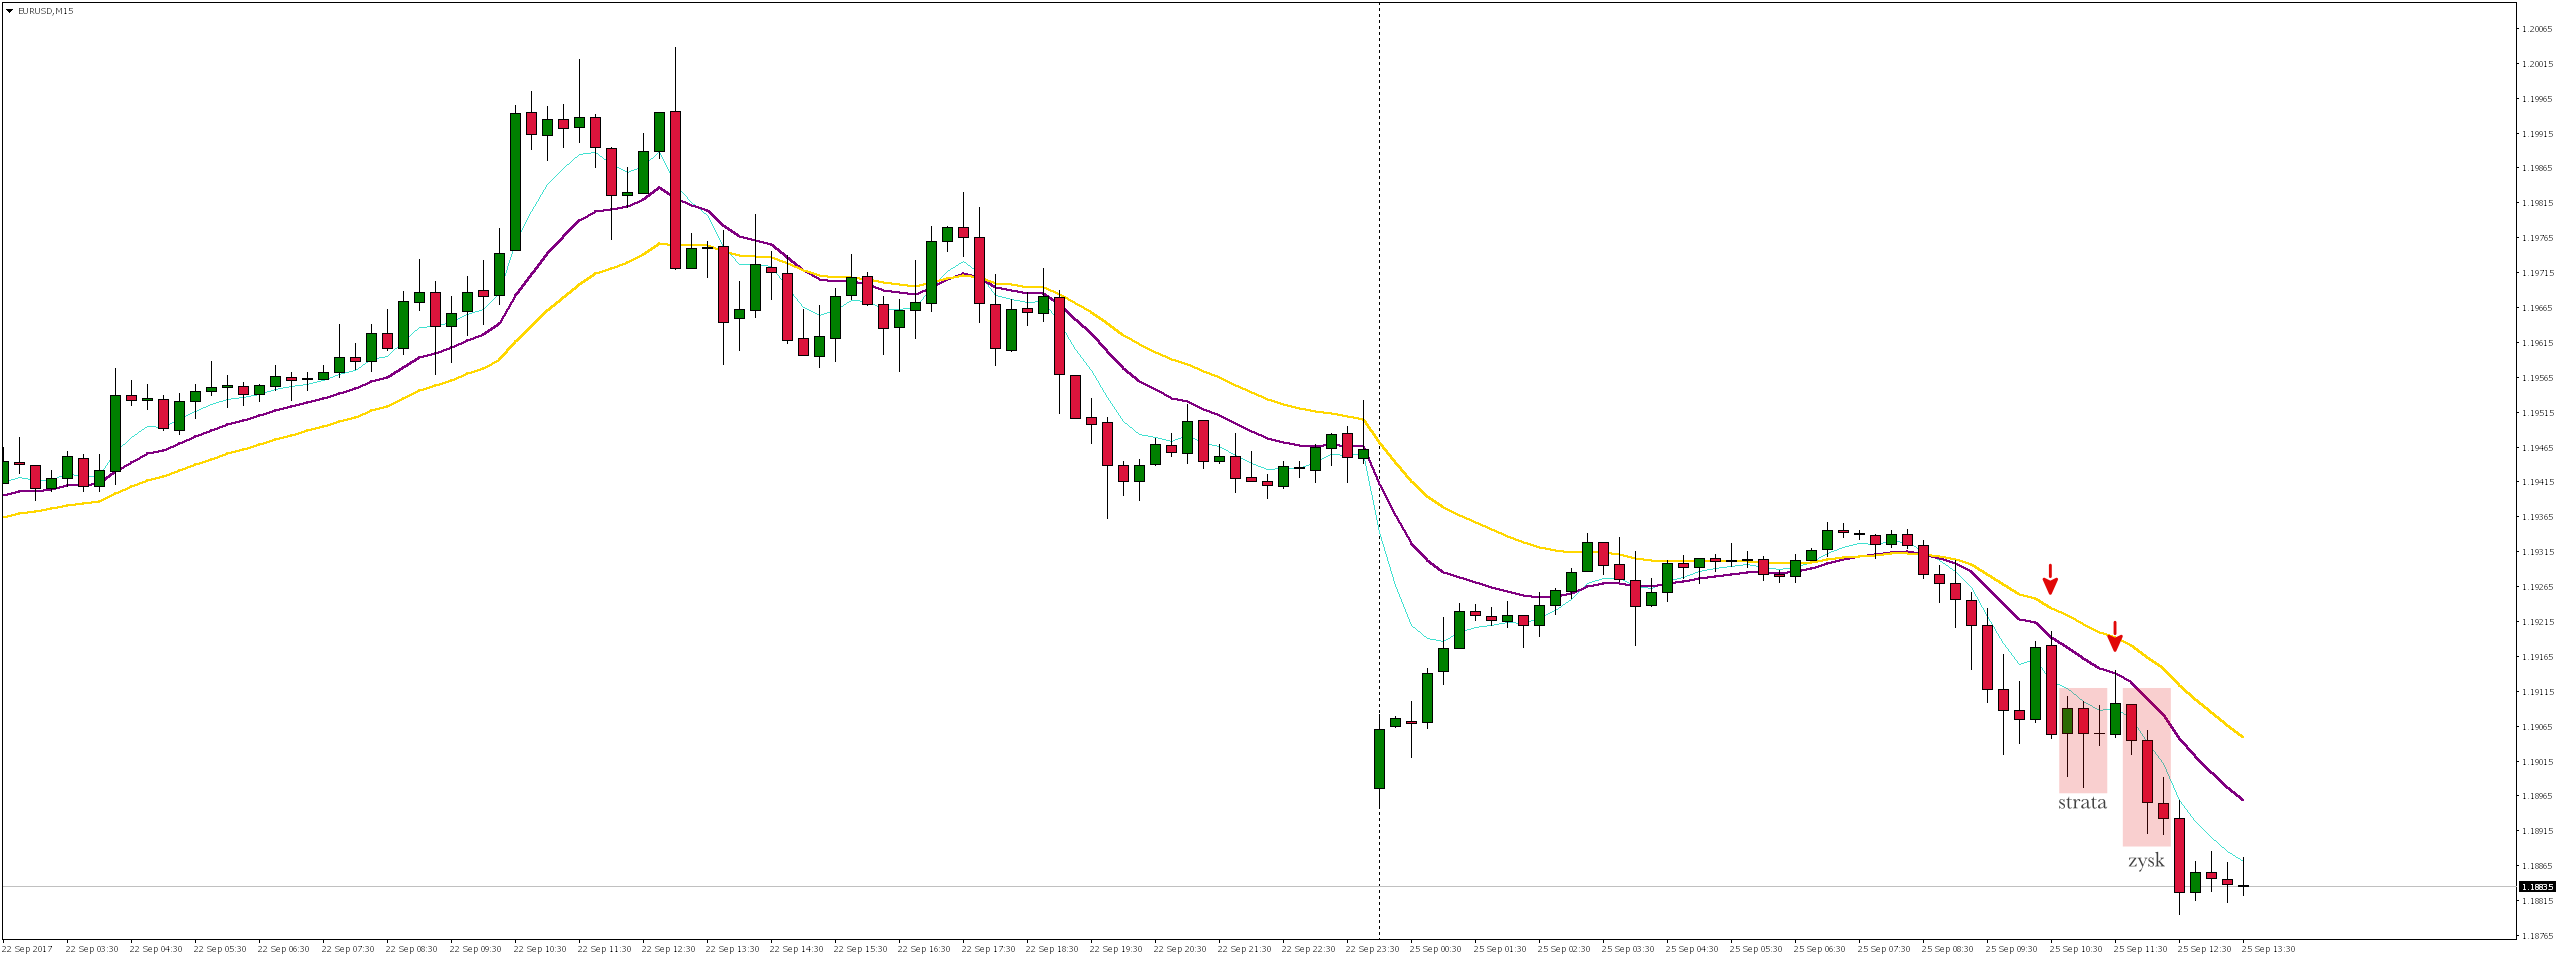
On the EURUSD pair only two signals occurred so far, the first of which was lost and the second profitable. The next opportunity we could look for on this instrument would be after correcting and re-testing the moving average EMA14.
I am aware that the above analyses depict historical set ups, but the whole cycle is supposed to:
- Show what signals on the chart you need to look for
- Check if the EMA Rainbow strategy is profitable
- If it is – you can start using it on your account according to strategy assumptions
As I mentioned in the introduction, on Saturday, October 7, I will publish a report summarizing the statistics of this strategy and will show whether or not during these two weeks we could make a profit.

Try trading on binary options on currencies, indices, commodities and shares of popular companies. If you lose, regardless of the size of the loss, you never lose more than you bet. You can also choose other expiration hours for options, both shorter and longer. Create a real account and earn 50 to 150% Welcome Bonus.


 Review")


