AUDUSD – D1

On daily chart we can see downtrend. We can identify lower bottoms and higher tops, we can separate corrections from impulses and we can see that averages have good shape, what suggest us to open short positions. We can see that price is making correction move. There is high possibility that price will re-test average line. Let’s take a closer look on trading chart.
AUDUSD – H4
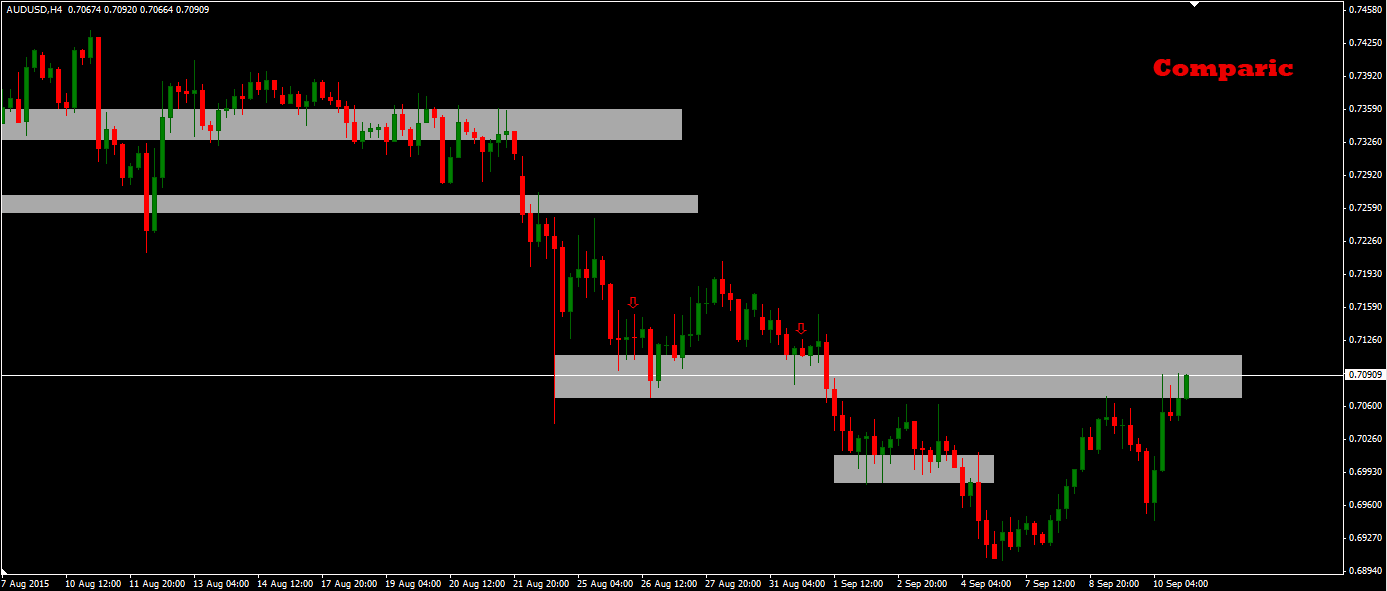
On trading chart we can see that price is in bigger correction. Currently price is in important support area, which is good opportunity to open position. Aggressive scenario assumes setting position in half of the area but we have to be careful, because there is very big probability that price will re-test average line. Confluences on the chart are two bases (marked on the chart above). Conservative scenario assumes opening position after candle signal. You have to remember about MM, this transaction requires no more than 2% of our deposit. It is very important to check correlation table of our transactions. If there is any correlation with open position on -0.7 or +0.7 level, you shouldn’t open position on this pair.


 Review")


