The account is unchanged and the score is still +18% since beginning of January. On Friday we hit Stop Loss twice – EURUSD and GBPJPY. As long as Eurodollar casted some doubts, the risk on the other pair was worth to take because last year two similar transactions on this pair were a success.
These losses were balanced by TP on GBPCHF and partly close of short on USDJPY. We still have two shorts opened: on AUDJPY and part of USDJPY order. Both are secured on zero and altogether they give 3% of profit. Let’s take a look at new opportunities:
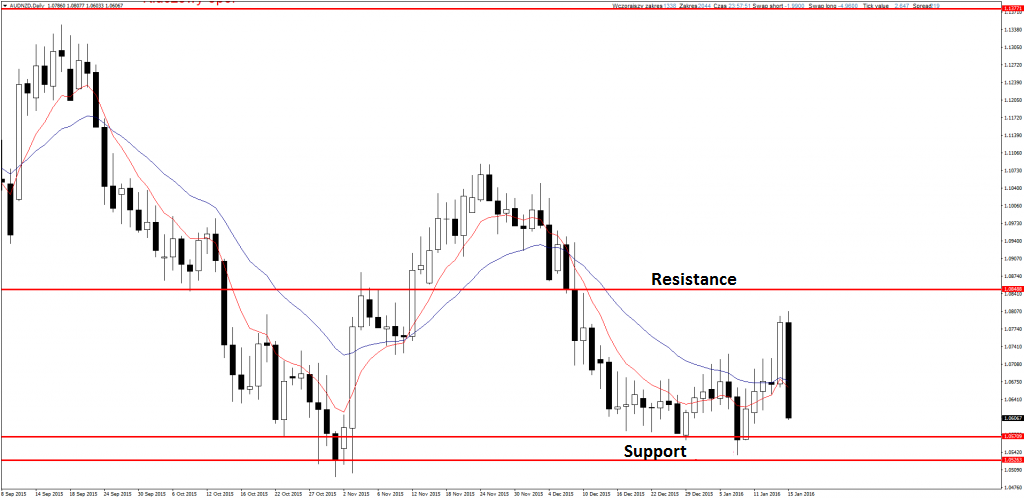
AUDNZD
Strong correction on this pair. Price is getting close to strong support and it will be worth to consider opening longs if there will be any Price Action buy signal during the test of mentioned level.
If you are interested in Price Action Strategy description, you can read it here.
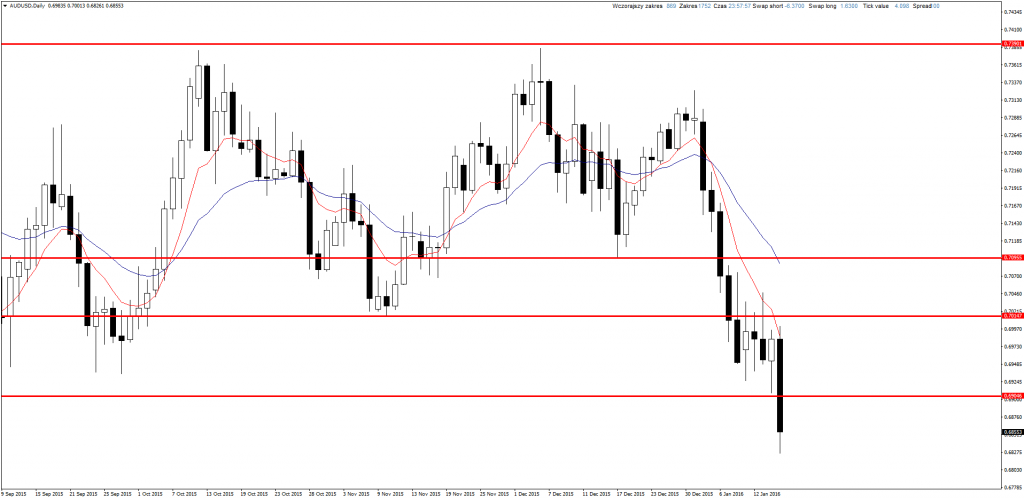
AUDUSD
Strong sellout on Aussie. Pair is at lowest level since 2009 and after breaking support further losses are almost certain. In longer period we can expect even 600 pips of decreases. We just have to wait for bullish correction and look for opportunity to open short position on H4 or D1 chart.
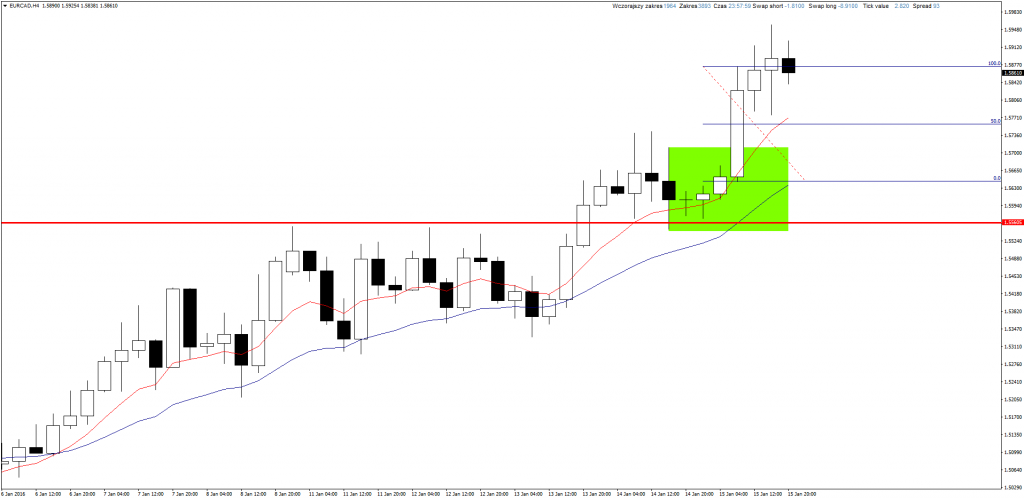
EURCAD
Buy signal on this pair. There was correct break out of Inside Bar setup and this is why I set buy limit order on 50% retracement of signal candle, Stop Loss lower and TP is about 300 pips.
YOU CAN START USING PRICE ACTION AND INVEST ON FOREX MARKET USING FREE XM BROKER ACCOUNT.
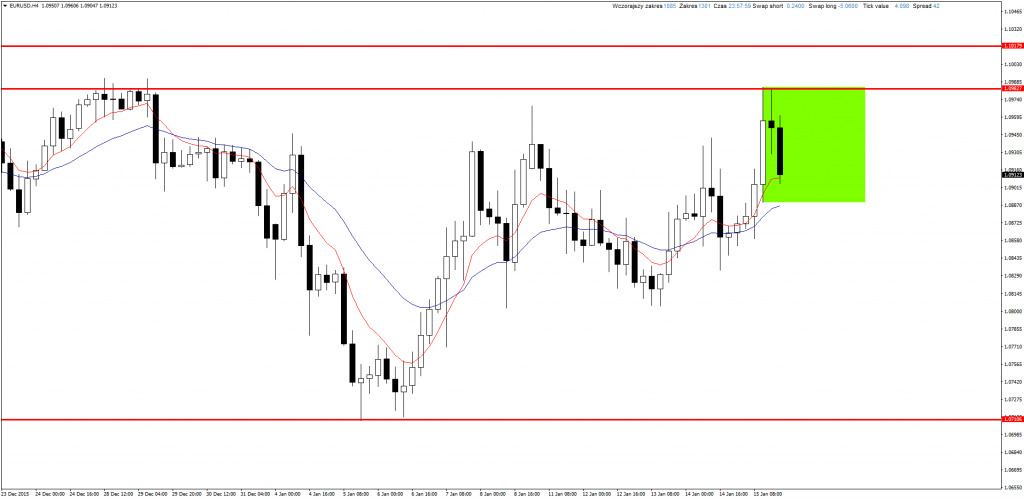
EURUSD
Eurodollar tested resistance yesterday and Inside Bar created. I see 3 possible scenarios for this pair:
- Break below and close below mother candle (range marked green on the chart). Then we can set sell limit order on 50% retracement of signal candle and Stop Loss above.
- Break above and close above mother candle and resistance. It will be a long signal and I will set buy limit order on 50% retracement with SL below.
- Break above and come back to mother candle range and opening short position with market price and SL above signal candle.
GBPJPY
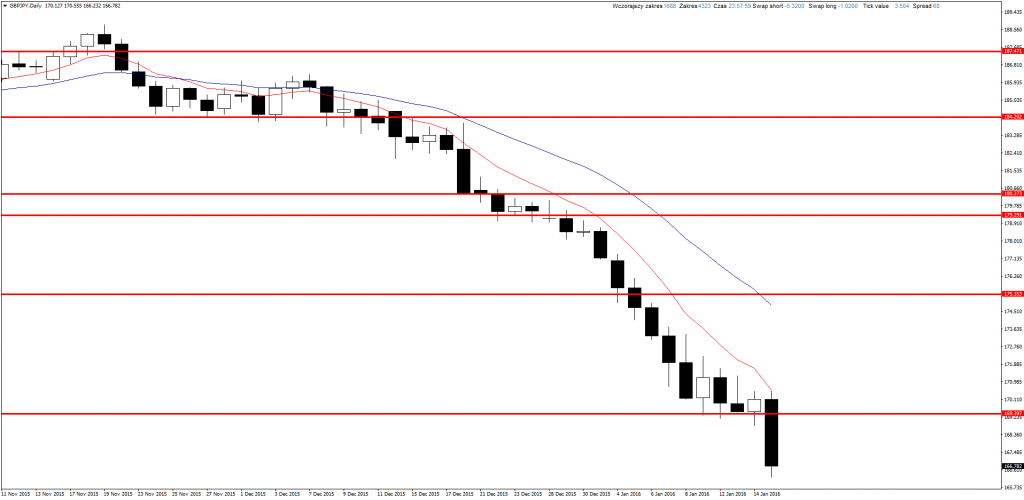
This is the mentioned Stop Loss. We can see strong move down, breaking support and again we can look only for shorts. Bullish correction can be great opportunity to do that, it should test area of earlier support (now resistance).
GBPUSD
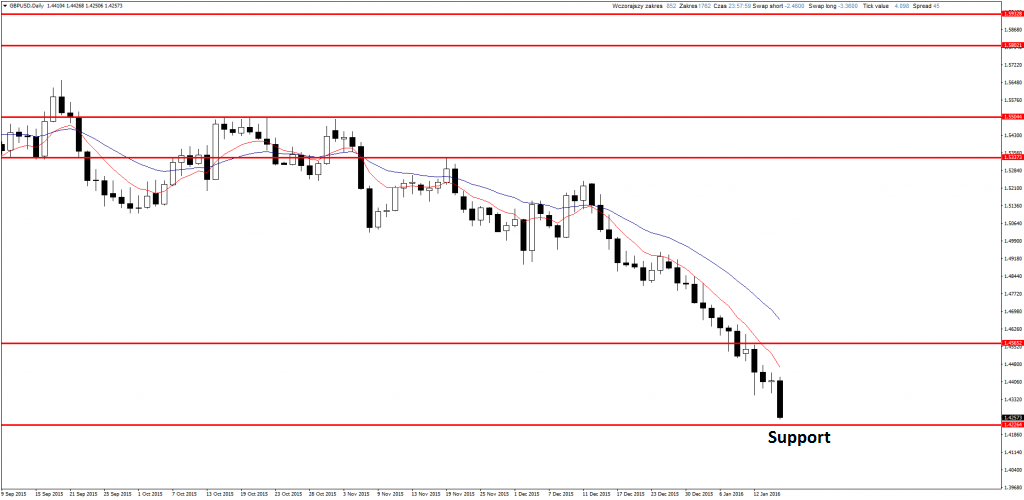
Cable is getting close to important support. It is a last band, after braking it we should see further dynamic losses. If there will be buy signal on the daily chart – clear one – I will consider playing longs, because on this level there can be bigger correction.
NZDUSD
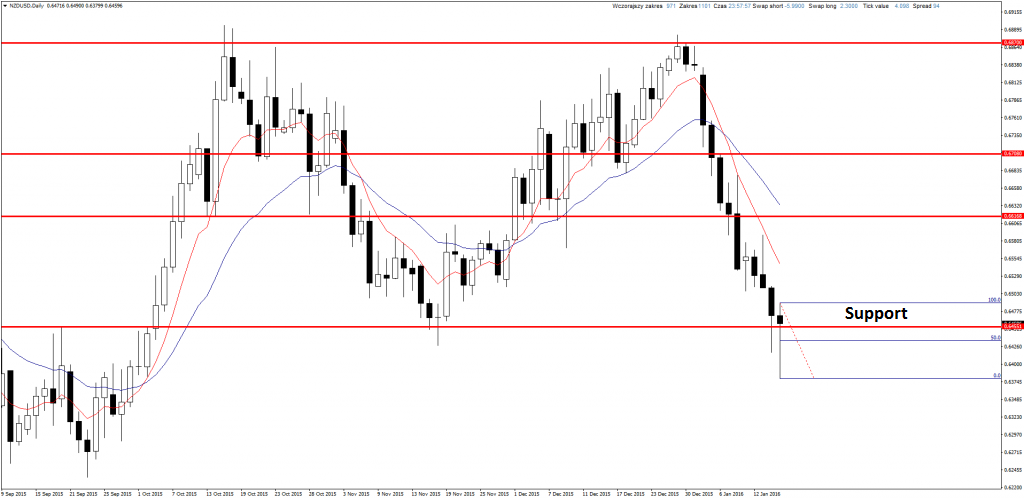
Buy signal on Kiwi. Pair dropped below support but then rebounded strongly and created Pin Bar. Stop Loss of this positon is 60 pips and Take Profit about 170 pips so minimal conditions for the position are met.


