Currently there are many signs that bearish scenario is realized, according to it DAX is in correction since April 2015 (I pointed out that scenario few months ago, when DAX was still way above 11,000 pts). Looking at waves theory now we see correction of bullish impulse which lasted from February 2009 till April 2015. Signal confirming this theory will be breaking of 2015 bottom, we are currently close to it.
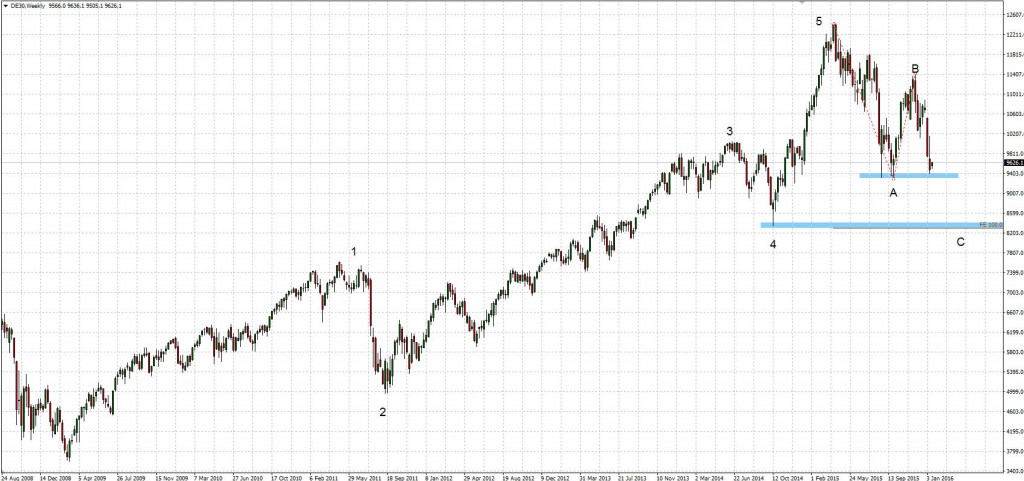
First support which can be target level for decreases is 8,900 pts level but more probable will be drop to 8,300 pts where we can find strong support and length of A will be equal with C. Theoretically there is also possibility of second scenario but the problem here is that even 88,6% fibo was already passed what doesn’t happen very often. There is high probability that we can see some bullish rebound because of US stocks. If there will be a rebound it would be strengthen by triple bottom pattern (seen on W1 chart).
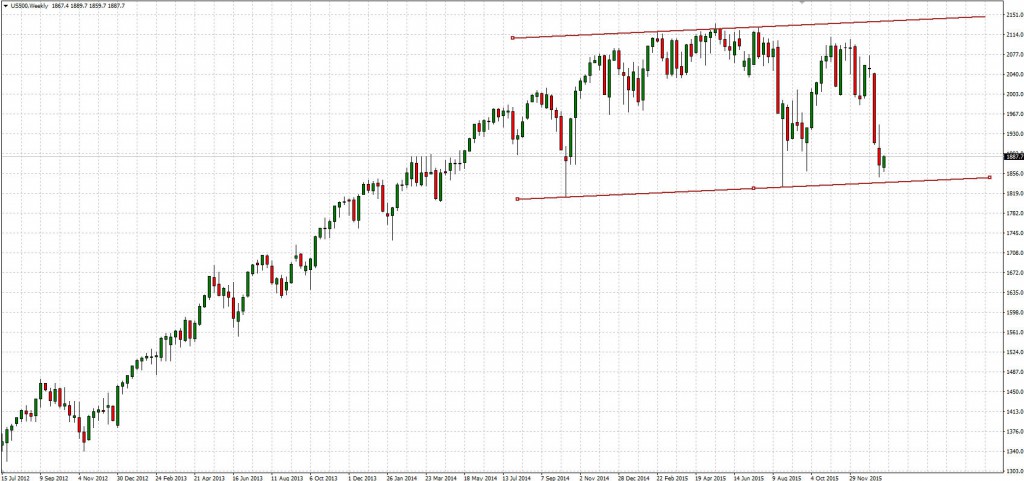
Wall Street influences on current decreases where S&P500 tested 1,860 pts support last week. FED meeting on January 27th can change the sentiment. If US central bank will give some dovish signal or at least show rate hikes scenario and it will be slow we can expect reverse of current weak sentiment on the stocks. Current situation confirms that Wall Street is pushing DAX and despite ECB actions which is just in halfway of easing, European stocks don’t rise. On the chart below we can see S&P500 future and important support reached by index, it can cause a rebound.


 Review")


