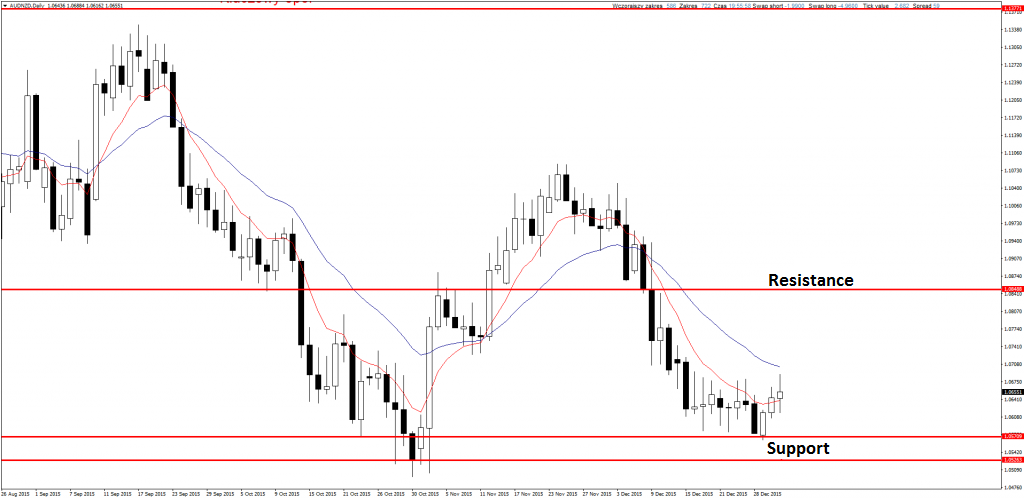
AUDNZD
This pair decreased to very important support and my ABC correction scenario was right. If there will be any Price Action buy signal on the daily chart we can consider opening long position. There is also a possibility of going back to bigger bearish trend, for that we should wait for breaking last year’s low.
If you are interested in Price Action Strategy description, you can read it here.
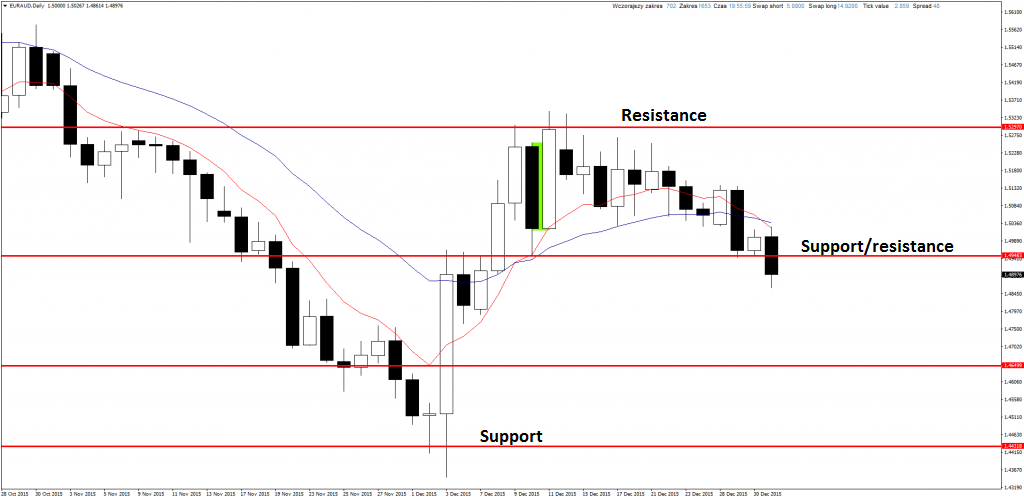
EURAUD
On December 31st there was a break of support what changes sentiment to bearish. In the next few sessions I will look for short signals – also on H4 chart, because momentum is bearish.
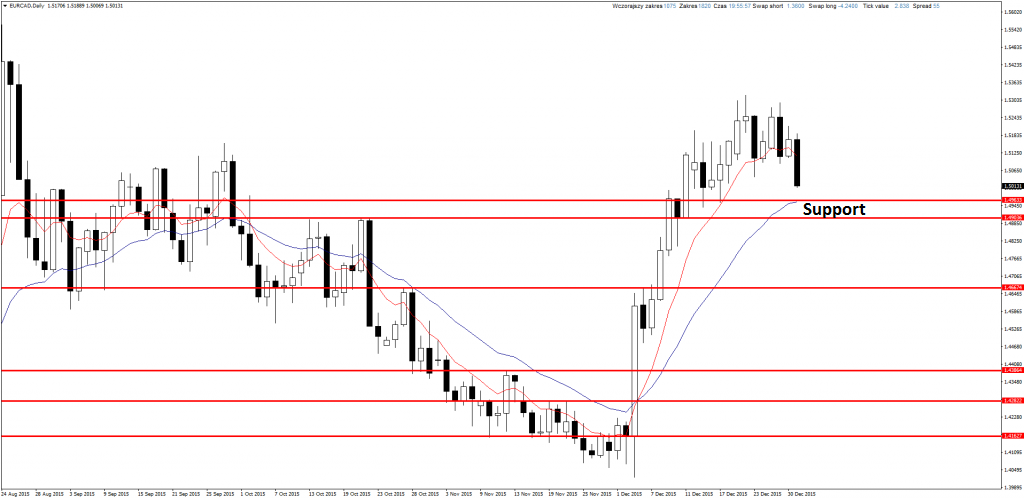
EURCAD
Support can still hold the price. Long term trend is bullish and corrections should be used to open long positions. I will observe price behaviour in case of the test of the support ant possible buy signal on the D1 chart will be used to open longs.
YOU CAN START USING PRICE ACTION AND INVEST ON FOREX MARKET USING FREE XM BROKER ACCOUNT.
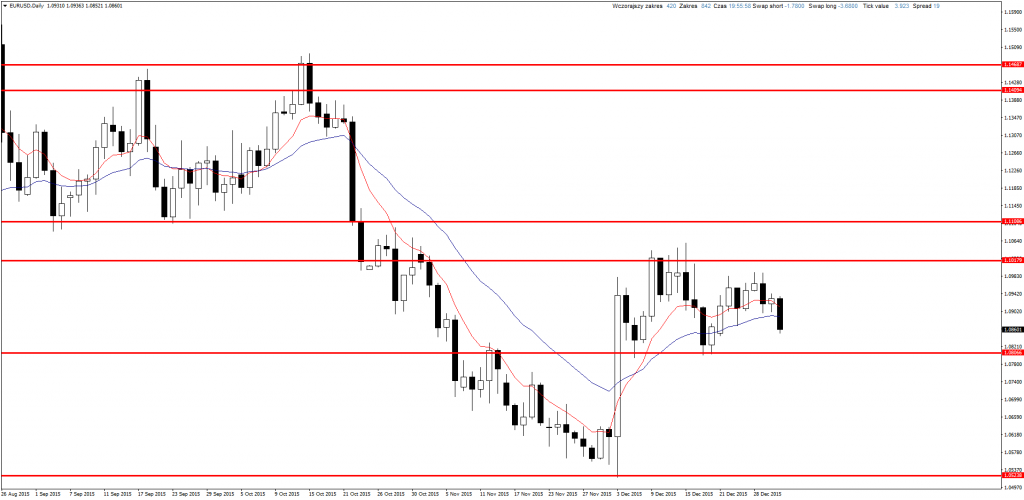
EURUSD
There is no long term trend on EURUSD but huge bullish candle which showed up after test of important support changes our view on the chart. All the time we are above support and for now I will play only long positions.
I have to say that I have some hopes with longs on this pair in 2016. I hope that US dollar will weaken and pair connected with it will be very good to play. Of course, as a trader, I will play only on the basis of chart, if there will be sell signal on EURUSD I will open position according to the system.
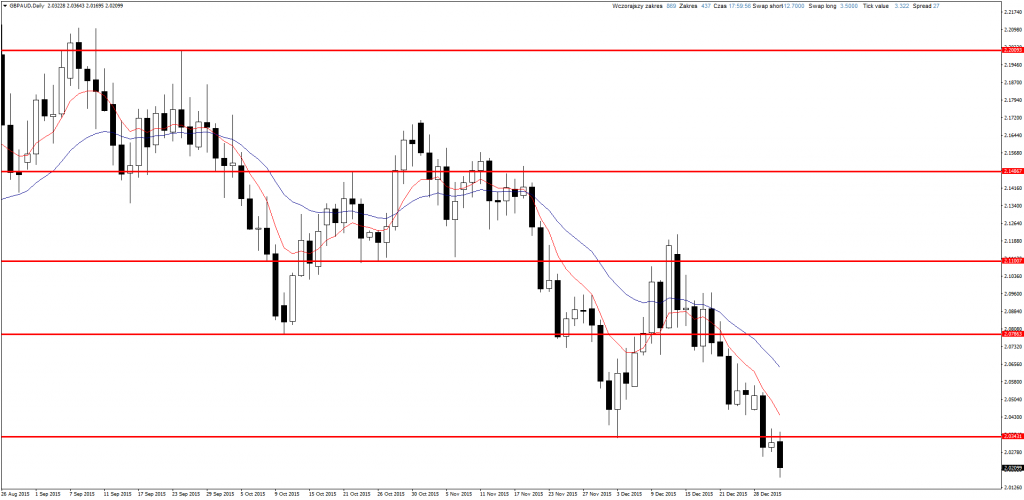
GBPAUD
Interesting situation on this pair. On Tuesday it broke support, on Wednesday there was sell signal in case of Pin Bar, on Thursday there was its test and then decrease. It will be very interesting opportunity if the timing will be good. I will watch price behaviour in the next sessions.
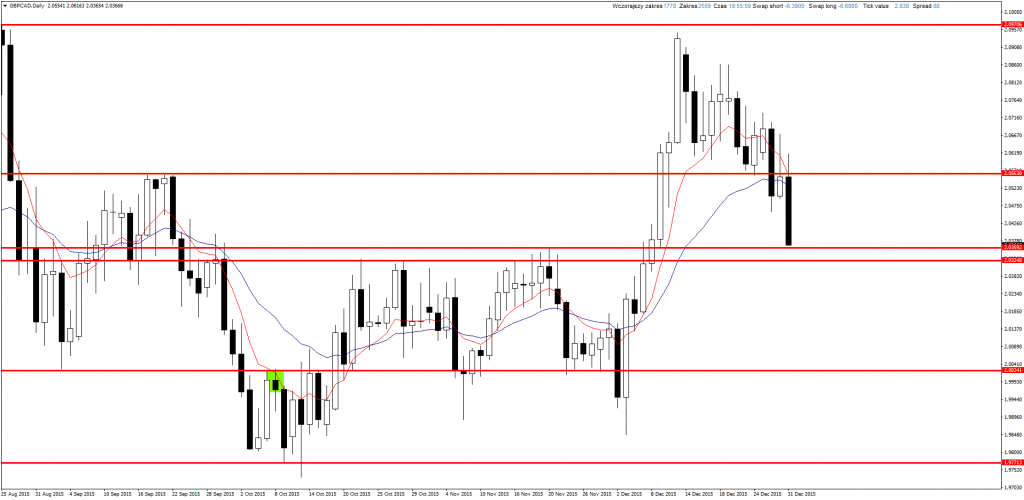
GBPCAD
Big decreases on this pair but support is still working. If we consider strong bearish momentum, we need really clear buy signal on the daily chart to open long positon.
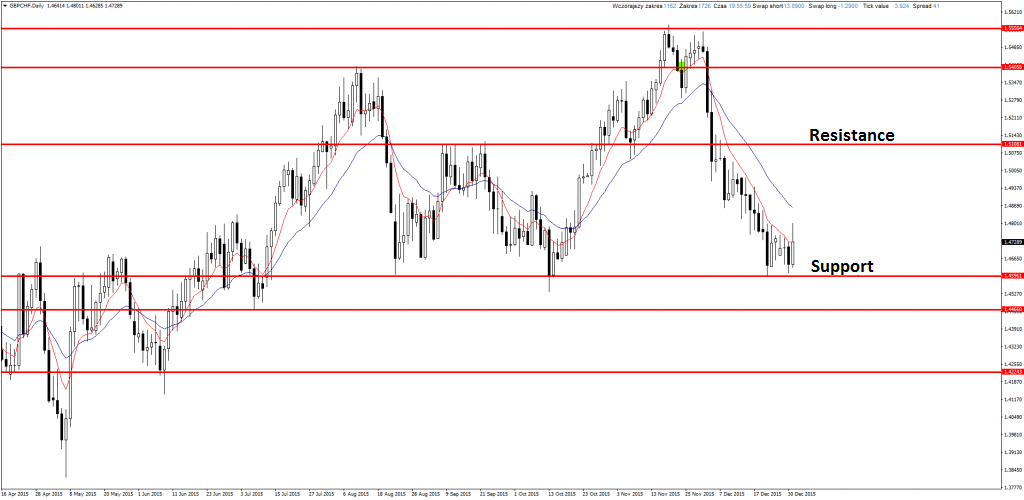
GBPCHF
This pair is also defending the support. In bigger time frame we can see that this level is very strong and rebounding from it can bring even 500 pips of profit. It is worth to observe this pair right now.
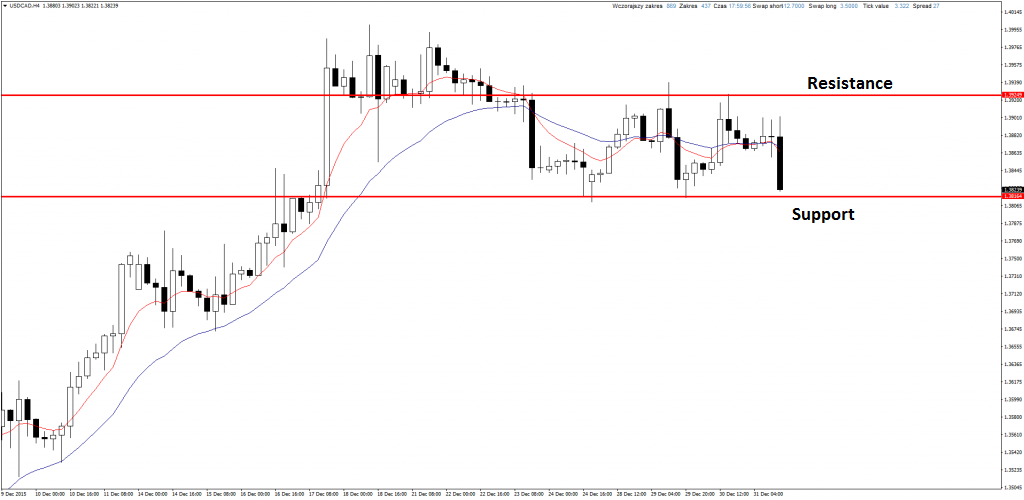
USDCAD
Usually I don’t look at smaller time frames in looking for the signals, only when on D1 we can see some moves consistent with the momentum. However on D1 there is no such situation as on H4. There is consolidation area in the bullish trend and it can be a chance to open long position consistent with the trend. There can be some buy signal soon.


 Review")


