Monthly S&P500 Emini futures candlestick chart: Learn how to trade breakout mode price action
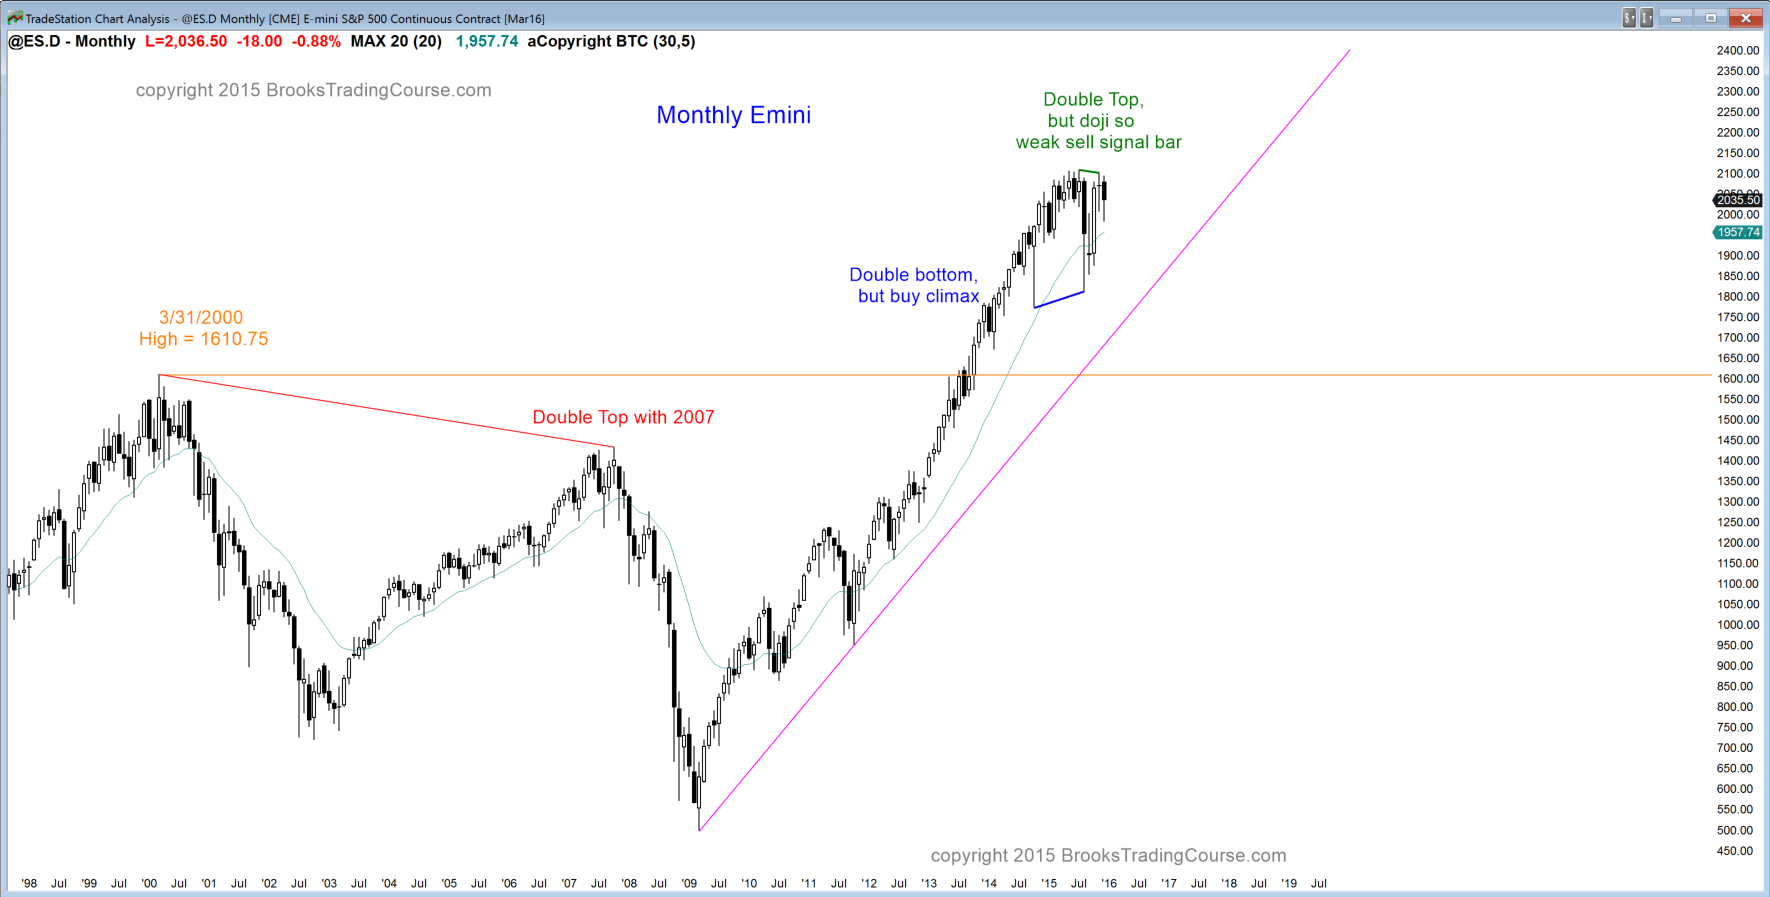
The monthly S&P500 Emini futures candlestick chart held above its monthly moving average for 38 months, which has happened only twice in the cash index in the past 50 years. When something rarely happens, it is unsustainable and therefore climactic. Even though the bull trend is strong and the yearlong pullback has held above the moving average, this correction still might not be enough to work off this extreme of a buy climax. When the S&P cash index held above its average for 44 months in 1998, it fell 22%. In 1987 after 38 months above the average price, it fell 36%. The current selloff has only corrected 14%.
The double top and double bottom create a breakout mode situation. Holding above the moving average is good for the bulls, but the buy climax is good for the bears. There is a 50% chance of a breakout to a new all-time high before a test of the August low, and a 50% chance of a test of the August low before a new high. Traders are aware that the breakout can lead to a measured move.
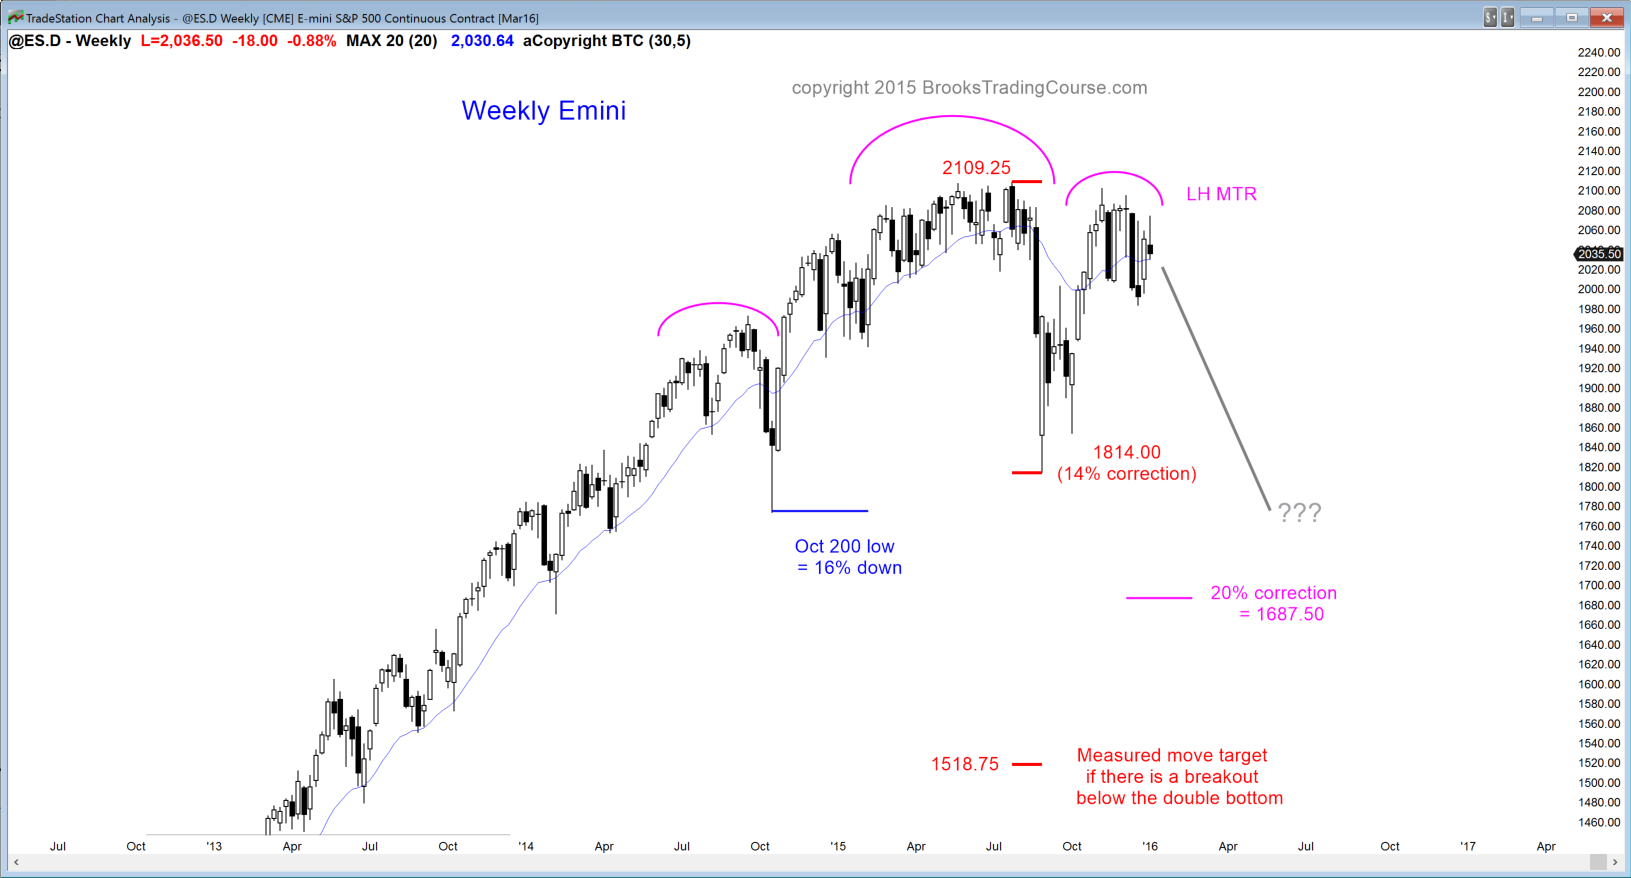
If the bulls get their breakout, a double bottom late in a bull trend is usually the final bull flag. This means that the breakout has a 60% chance of failing, and then reversing back into or below the bull flag.
If there is going to be a measured move after the breakout, it is more likely to happen with a bear breakout because major support is around a measured move down. The 2000 and 2007 double top has yet to be tested, and there is a 70% chance that it will, even if the bulls 1st get a strong breakout above the range. There is also a bull trend line around 1700, which would require about a 20% correction. This would be closer to the size of the reversals after the 2 prior comparable buy climaxes.
There has yet to be a strong sell signal bar. November was a doji after a big bull bar. The odds favored sideways rather than down. If a market sells off without a strong sell signal bar, traders will not begin to believe that a bear trend has begun until there is either one or two big bear bars, or a series of consecutive bear bars closing near their lows. Without that, more trading range price action is likely.
Weekly S&P500 Emini futures candlestick chart: Testing top of trading range
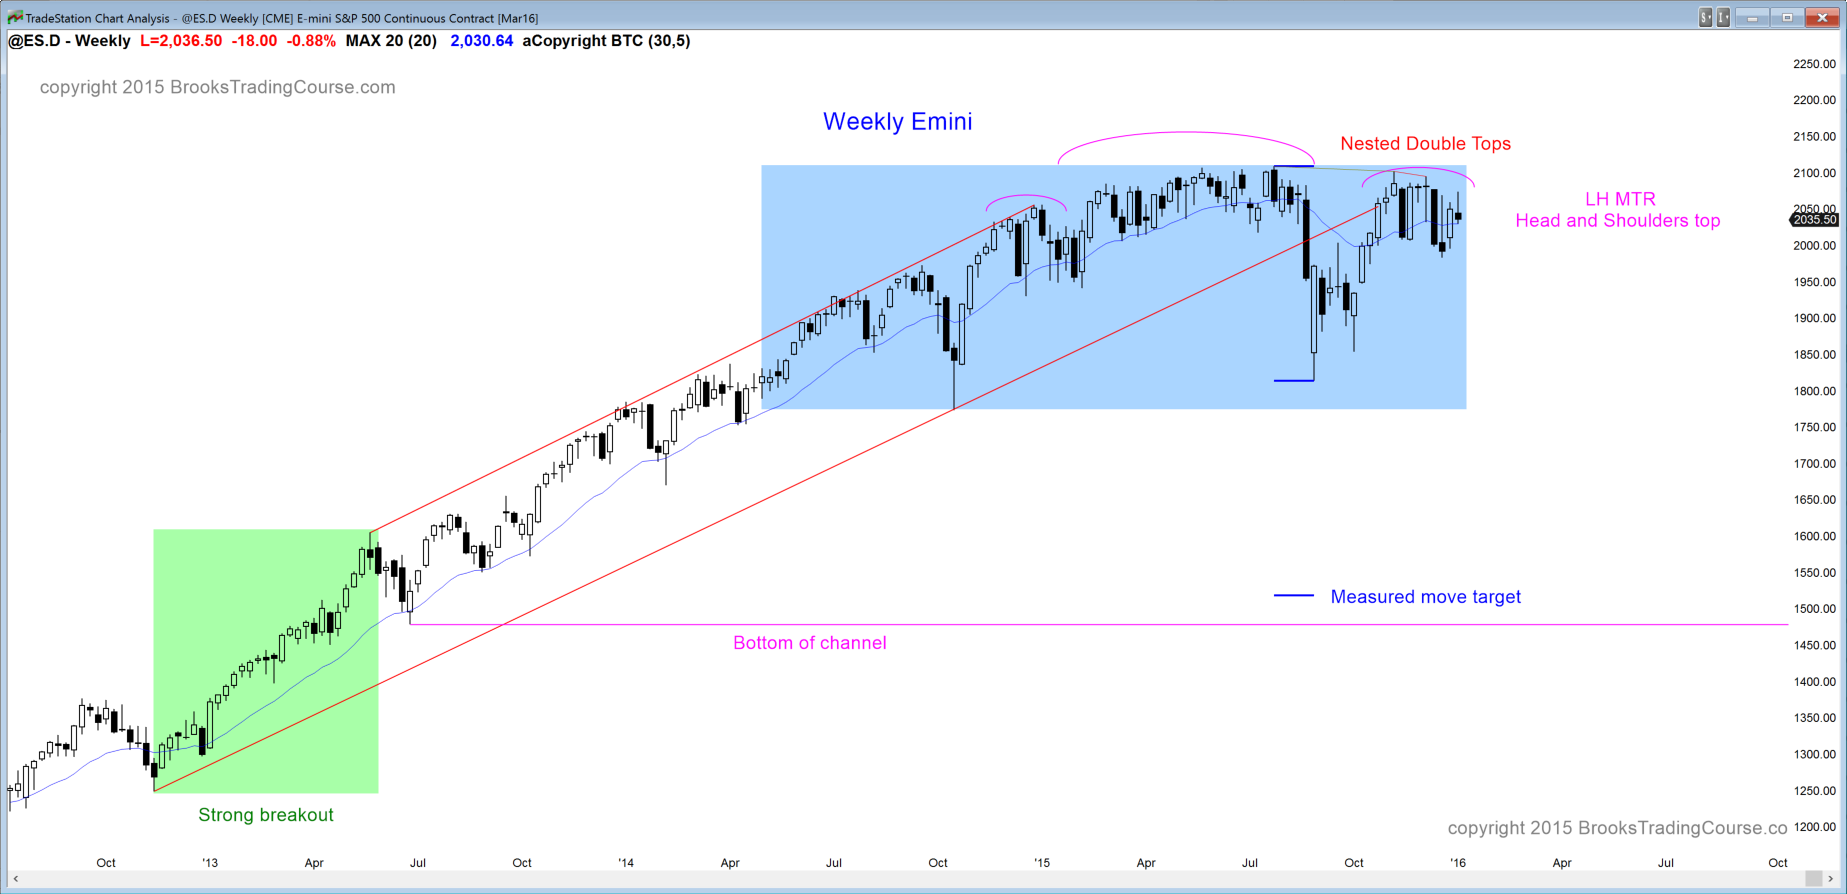
The weekly S&P500 Emini futures candlestick chart is at the top of a trading range. Traders expect ta measured move up or down to begin soon. Although there is a lower high major trend reversal (head and shoulders top), tops have only a 40% chance of leading to a bear breakout and a swing down. There is a 60% chance that the trading range continues or that there will be a bull breakout instead.
Last week formed a bear sell signal bar, but the body was small, the close was above the moving average, and it was in the middle of an 11 bar tight trading range. The odds are that the tight trading range will continue for at least another few bars (weeks).
If the bears take control, a measured move down is around 15100. This is also the bottom of the tight bull channel that began in 2013. That followed a strong bull breakout (spike). This is a spike and channel bull trend, which is a type of buy climax. There is a 60% chance of a trading range, which began with the August bear breakout below the bull channel. There is also about a 50% chance of the bottom of the channel. That 1500 target is also a measured move down from the yearlong trading range (head and shoulders top).
The right shoulder is almost at the July all-time high, so the candlestick pattern is also a big double top. The bulls want a bull breakout above the double top and then a measured move up. Although there is a 50% chance of a bull breakout, there is only a 40% chance of a measured move up because the spike and channel is a buy climax, and it is usually followed by 2 clear legs down. The August low is one leg. If the Emini breaks to a new all-time high, the breakout will probably fail. The 2nd leg down will then be from a higher high. That would also be an expanding triangle top, which always is a higher high major trend reversal.
Daily S&P500 Emini futures candlestick chart: Trading range, but lower highs so early bear channel
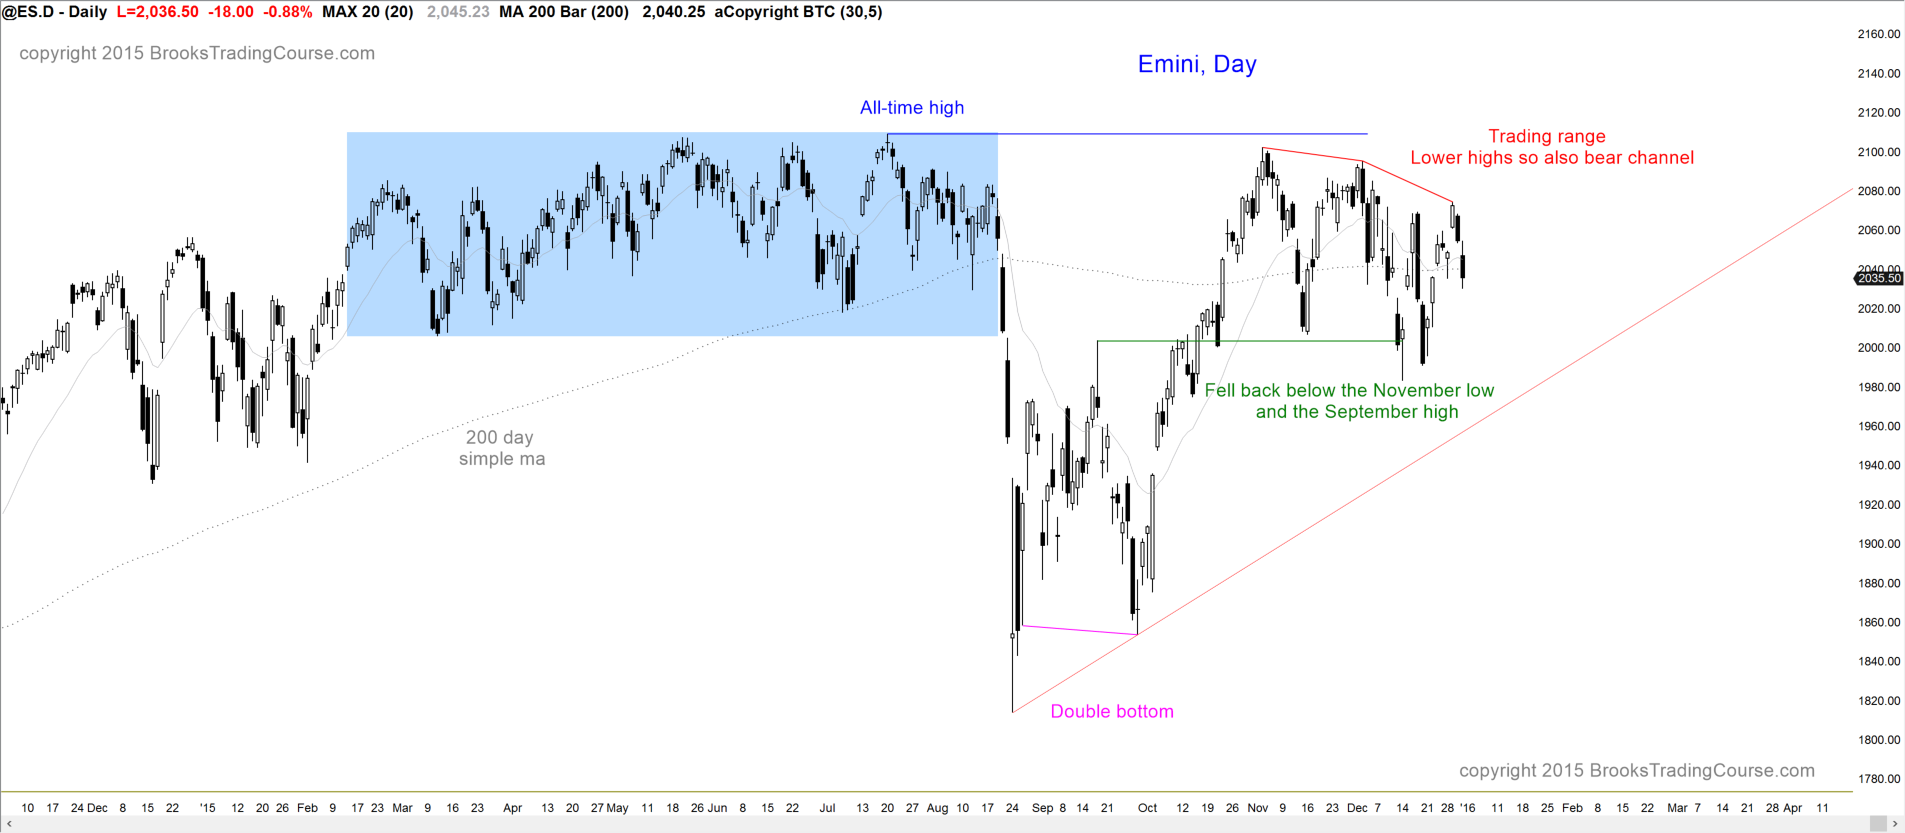
The daily S&P500 Emini futures candlestick chart has been in a trading range for a year. It has had 4 strong rallies since the October low, but the rallies failed to break above the trading range, and have been forming lower highs. The bulls see the 2 month bear channel as a bull flag. The bears see it as an early bear trend. Trading ranges always contain both bottoms and tops, but they are a sign of a balanced market. The chance of a bull breakout or a bear breakout is 50%. I have said this repeatedly after ever strong rally and selloff over the past 2 months.
I have constantly said that the chance that any one of the strong legs would lead to a breakout was only 20%. This is my 80% rule. In a trading range, no matter how strong a leg is, there is an 80% chance that the breakout attempt will fail and reverse. Obviously, eventually one will succeed, but each attempt only has a 20% chance of success. Until there is a breakout, traders will continue to sell out of longs and short near the top, and buy back shorts and buy new longs near the bottom.


 Review")


