“Search, Analyse, Trade” is a series of Price Action and Elliott Waves analyses. Its detailed step-by-step description can be found over here. I invite you to today’s review of selected currency pairs and potential trading opportunities. The analyses are based on the Dukascopy sentiment that you can get here.
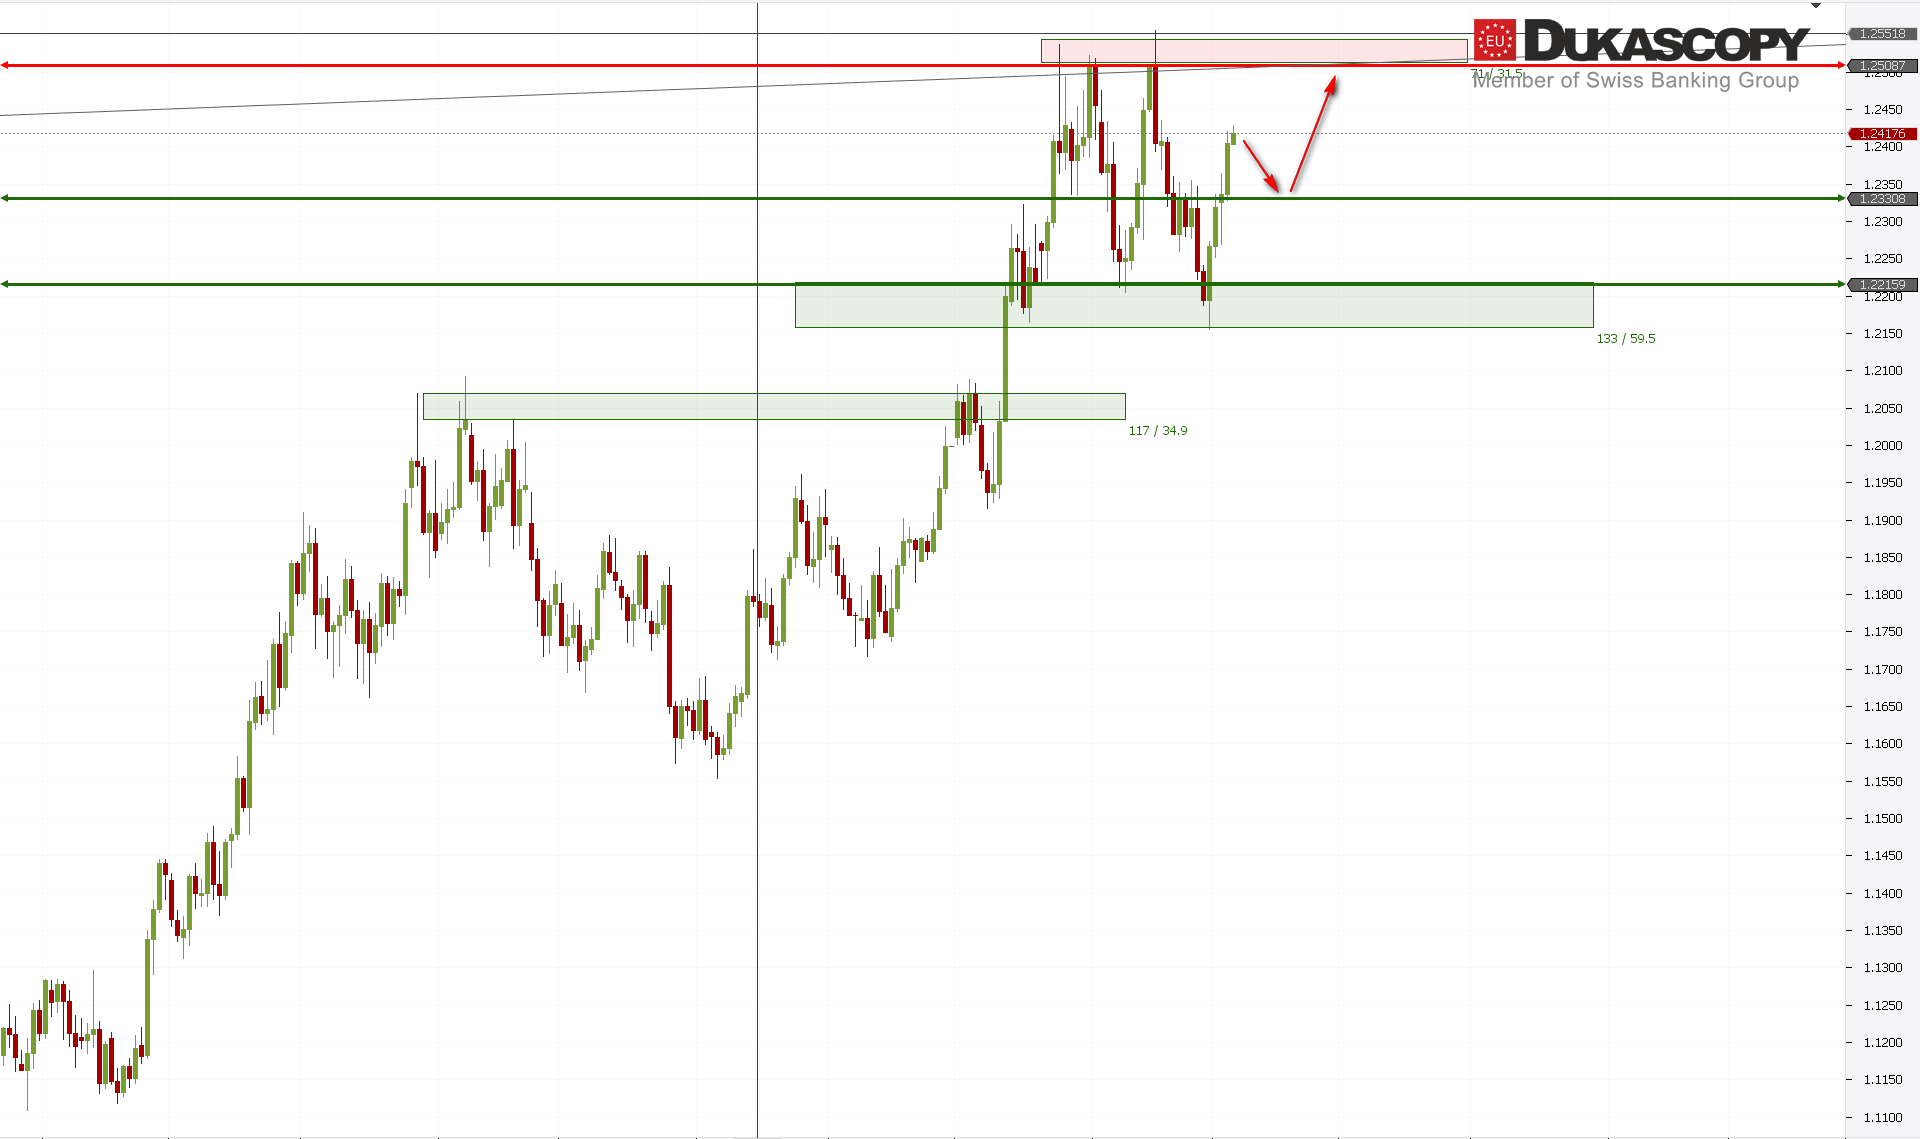
EUR/USD managed to break the resistance zone, whit which had had trouble for some time. It looks more and more like a scenario with a regular correction and continuation of the upward trend, rather than on the B wave in the form of an irregular correction. If the pair succeeds in maintaining the defeated resistance, the chance to attack the highs will be very possible.
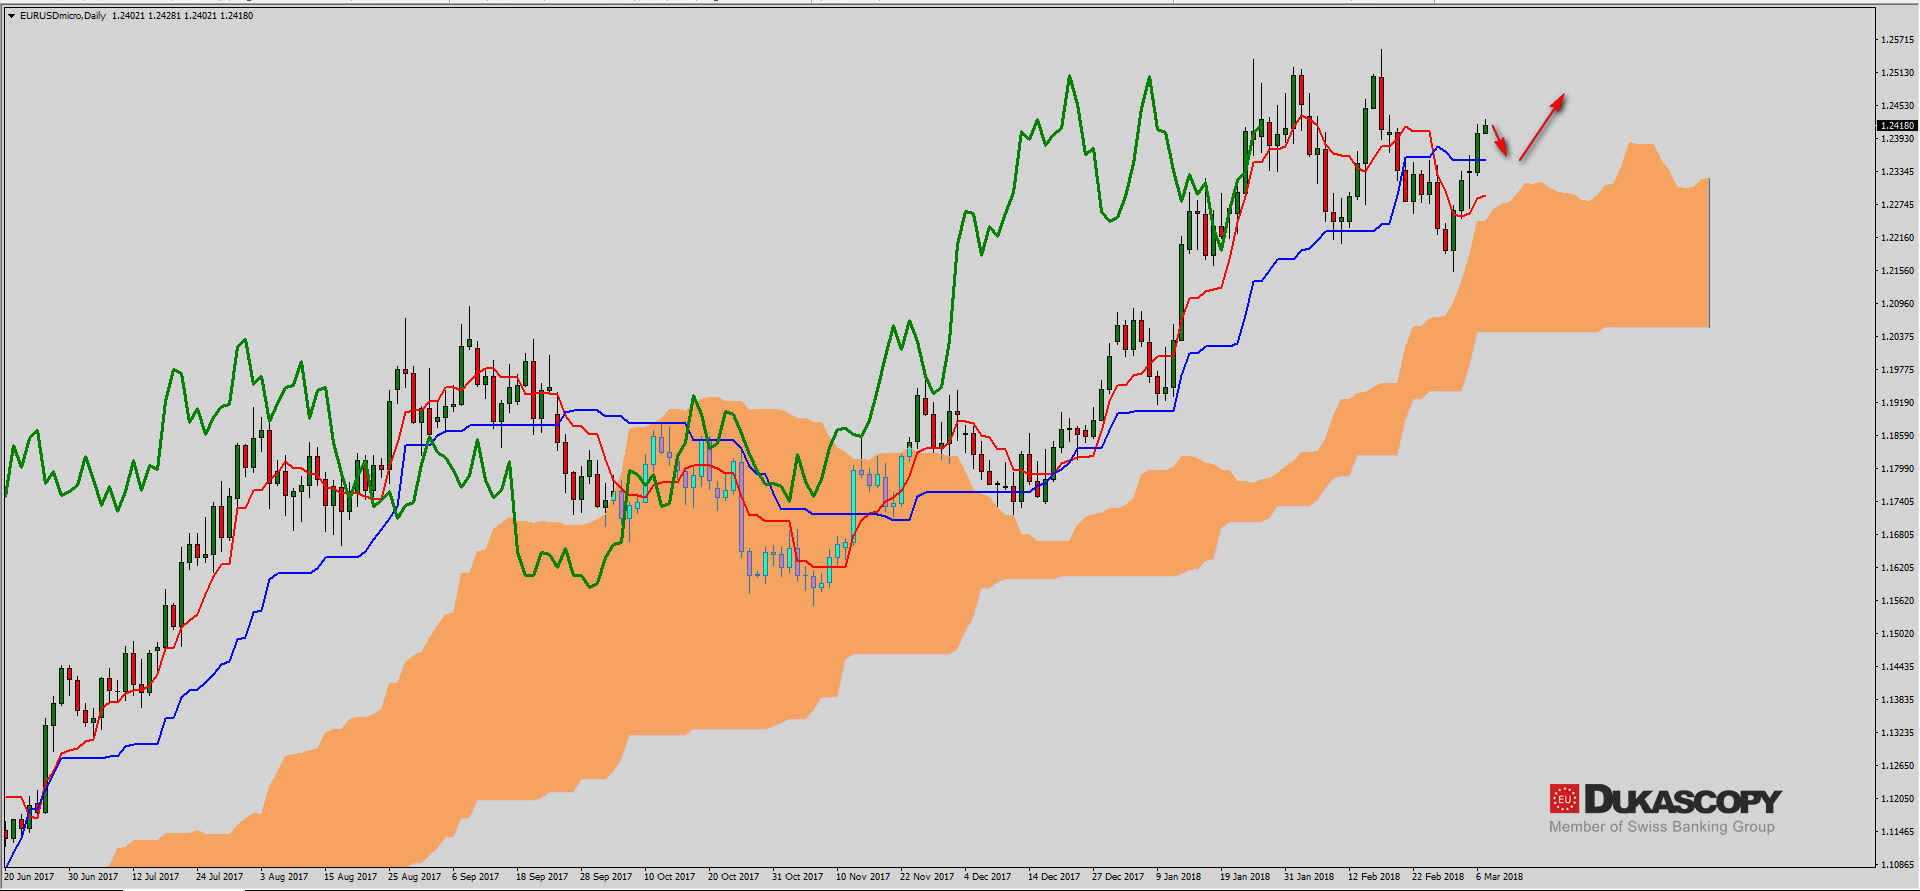 On the Ichimoku chart, we can see that the pair managed to defeat the Tenkan lines and Kijun line yesterday. Therefore, there is a chance for an upward movement. The lines layout itself is not yet bullish. The Kijun line is over Tenkan, which is slowly starting to move towards it and perhaps the lines will cut in the near future. The Chikou line is slowly entering the price range, which indicates consolidation.
The sentiment has been changing in favor of shorts for some time. This allows us to look for a bearish position, but Ichimoku will not allow it at this stage. A good place to take position without looking at the sentiment, will be a re-test of the Kijun line and play for the next growth “leg”.
The partner of “Search, Analyse, Trade” series is a Dukascopy Europe broker who gives its customers access to ECN accounts in different currencies.
Trade on Forex, indices and commodities thanks to Swiss FX & CFD Marketplace. Open free trading account right now.
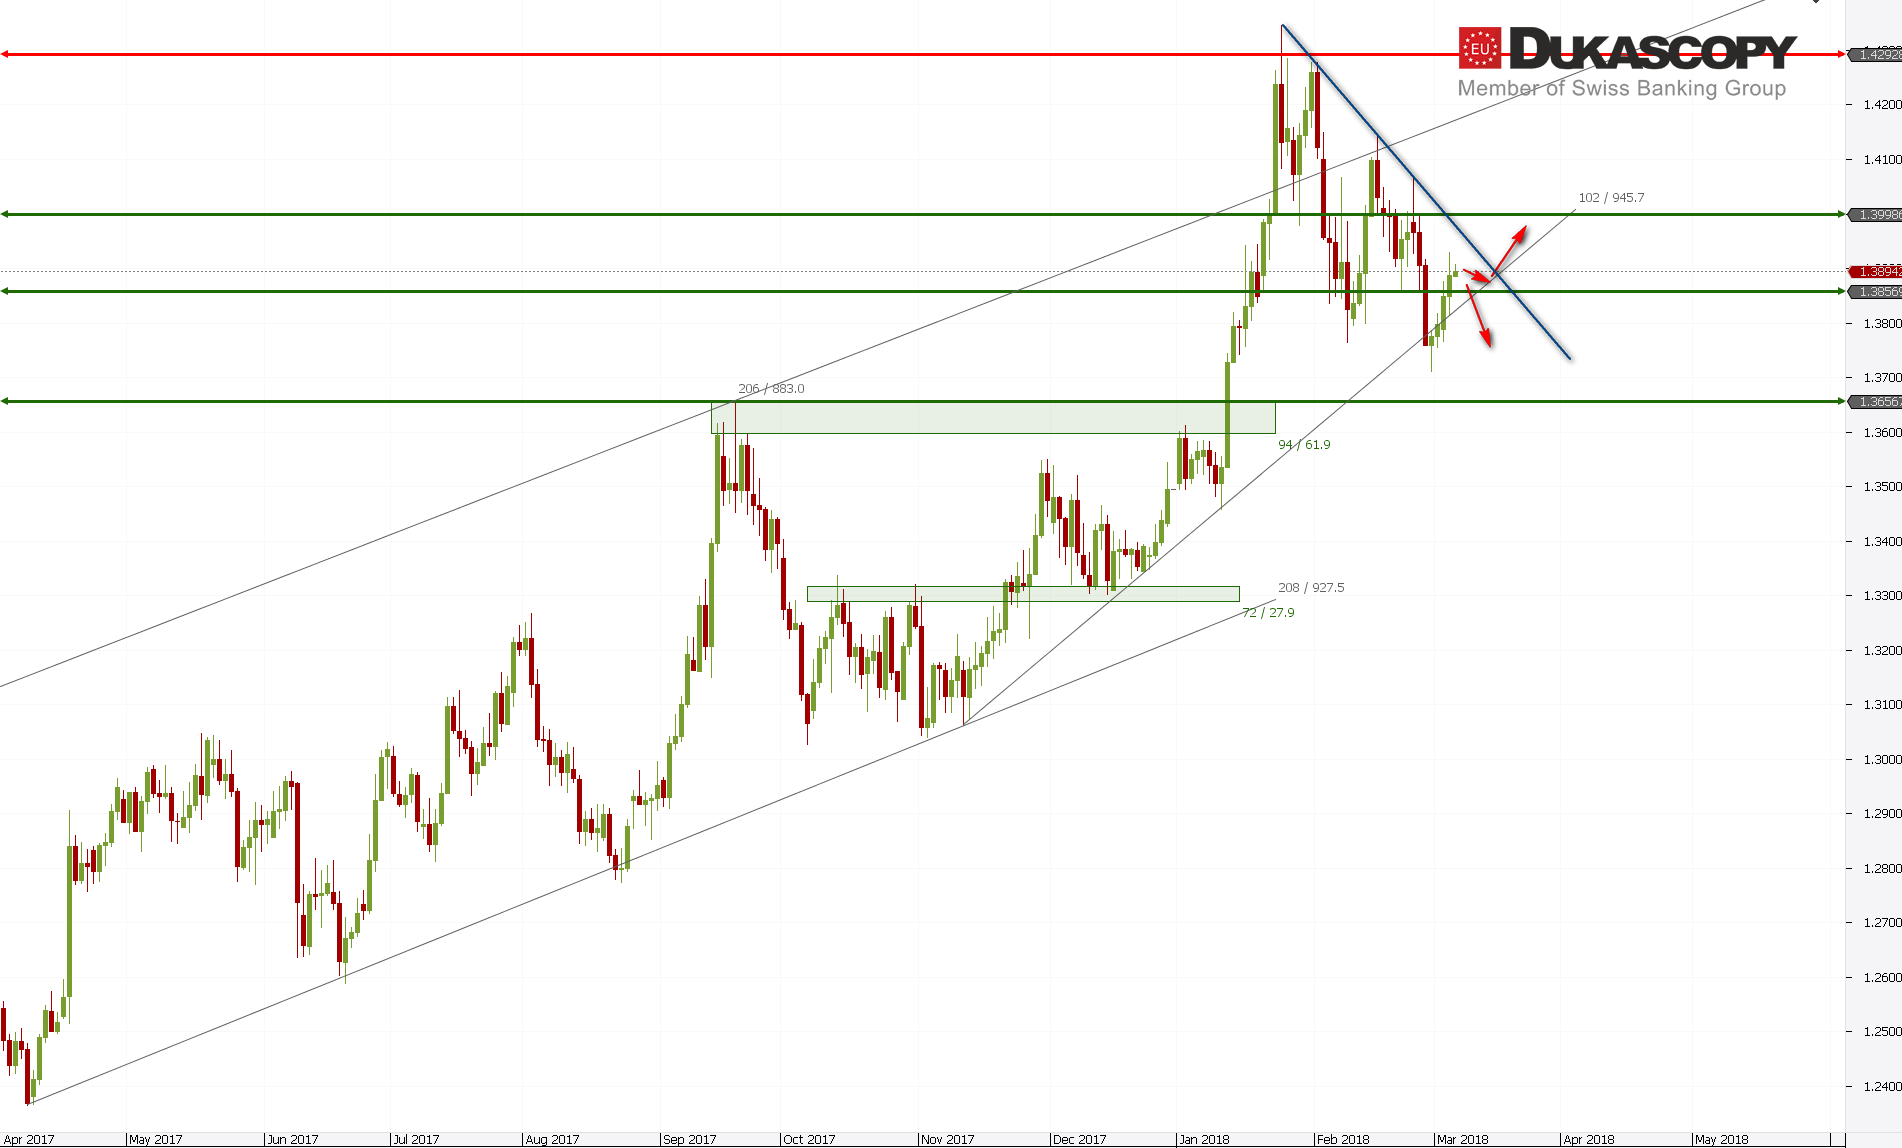
GBP/USD has managed to hold the trend lines. Pin Bar was created and the pair moved up and currently is testing the upper limit of the resistance zone. Its overcoming should lead to a move in the direction of the line drawn over the highs. Its rejection will probably lead to another test of the trend line, and its defeat to move towards the key support zone.
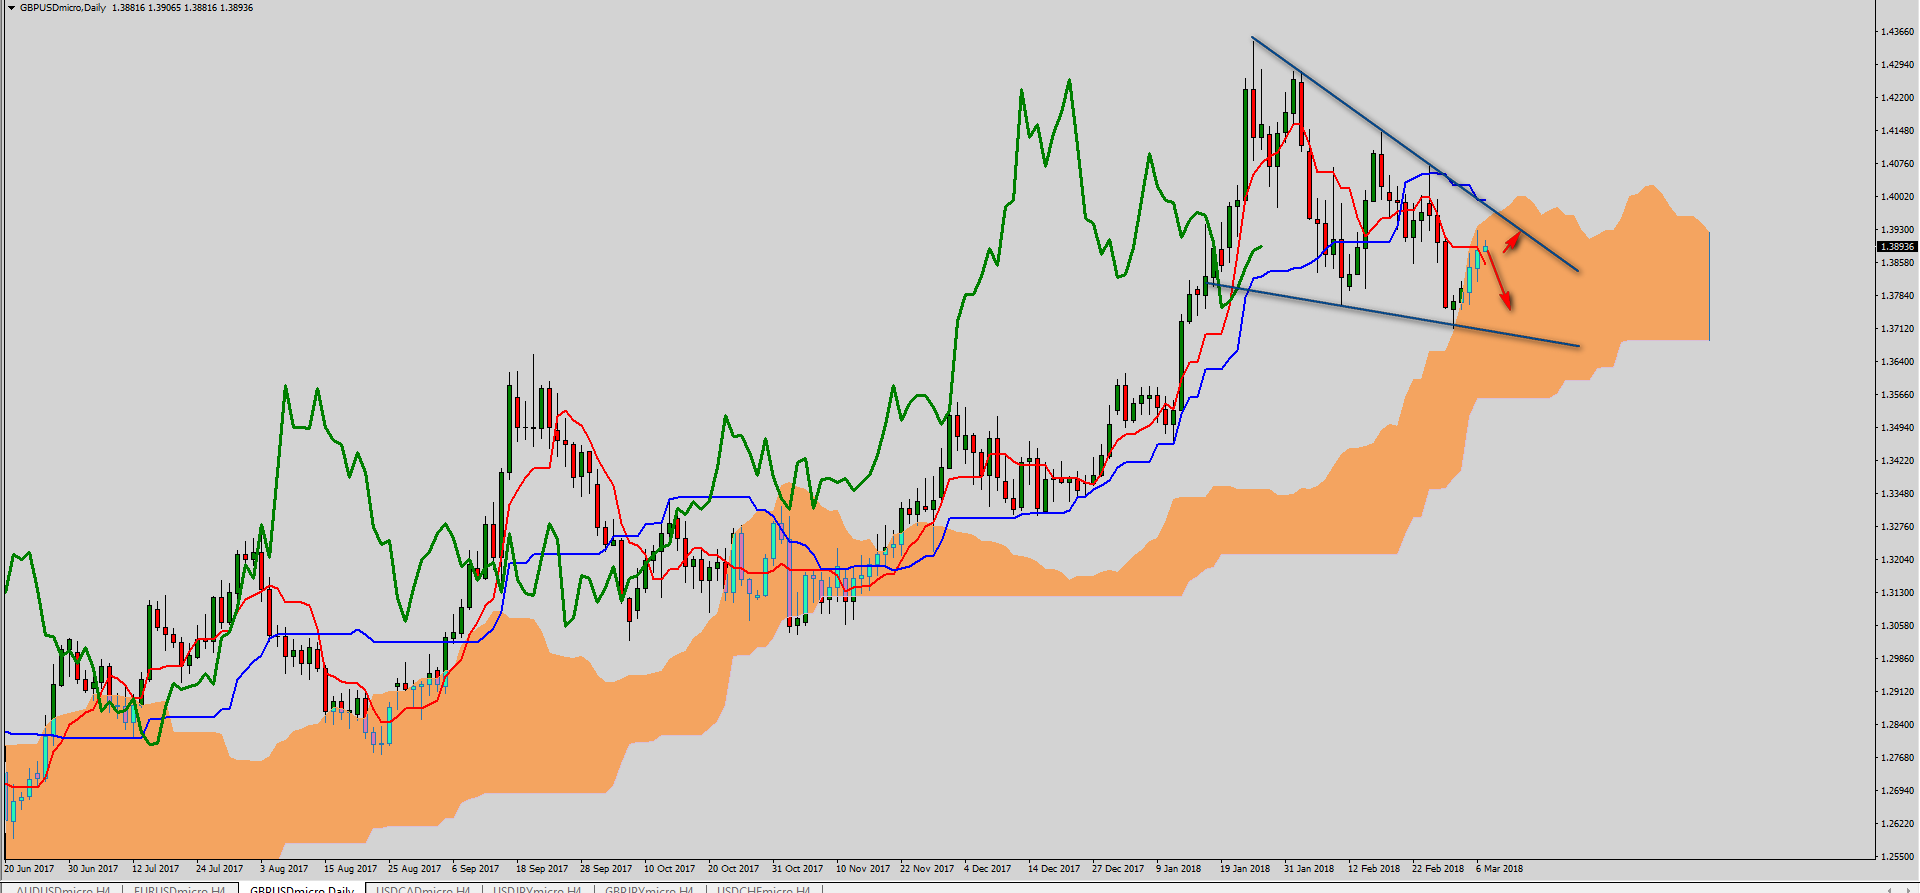 On the Ichimoku chart, the lines are slowly falling down. Last week we had a cross over the cloud, which is a weak sell signal. It was a very weak signal because at the intersection both lines grew. Now the situation is slowly changing and both lines are down. The Chikou line is under the price and the price is in the cloud itself and fights with the Tenakan and Senkou span A.
 The sentiment is still bearish and, in combination with Ichimoku, a signal may occur to take a short position but it may take some time .
 USD/JPY after having rejected the key resistance zone reached the support tested many times. Interpretation for this pair does not change and if the pair succeeds in overcoming the level, the move towards level 103.400 will be probable. However, if the current declining wave is the fifth wave ending the last downward segment, then you can expect to continue sideways as part of the fourth wave of the higher order.
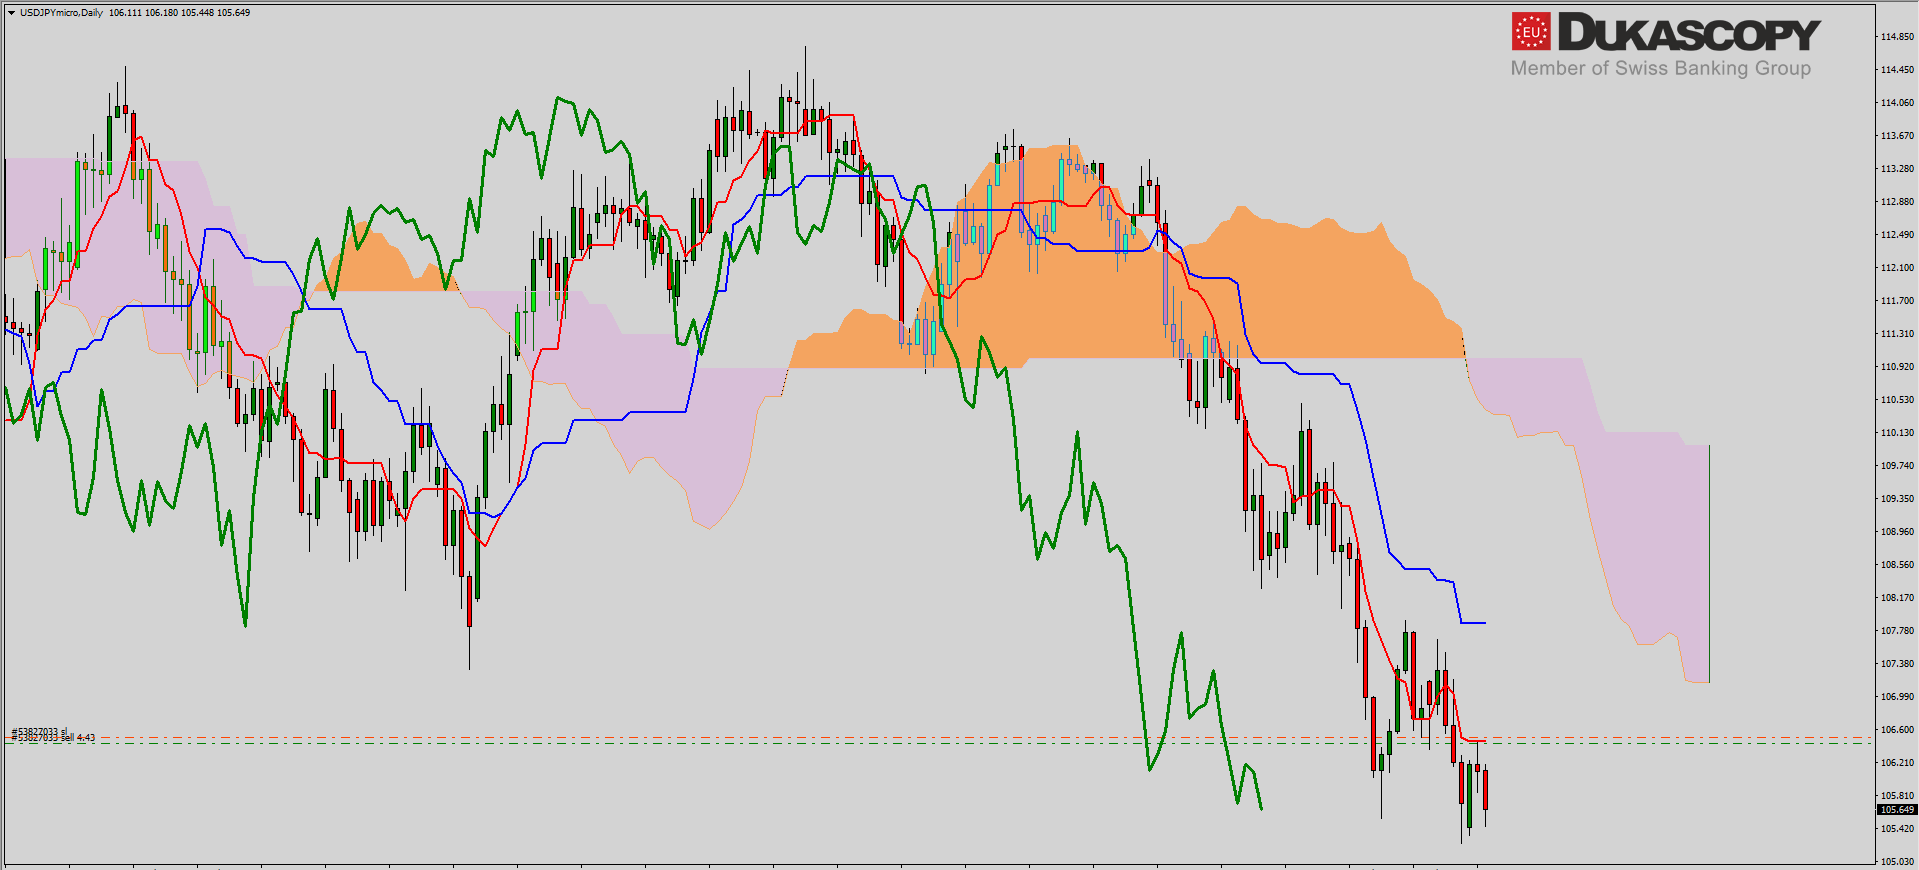 The Ichimoku chart shows a strong downward trend. The last consolidation and movement at the Tenkan line ended with a downward breakout and a re-test of the line, which is starting to go sideways again. Similarly, the Kijun line goes flat and is far away from the price. On the Chikou line you can clearly see the waves and that the current drop may be the ending wave of the last downward wave.
The sentiment in case of this pair does not change too much and we are constantly focused on increases. In the case of such a Ichimoku chart, it is not possible to take a position, so I remain on side.


