“Search, Analyse, Trade” is a series of Price Action and Elliott Waves analyses. Its detailed step-by-step description can be found over here. I invite you to today’s review of selected currency pairs and potential trading opportunities. The analyses are based on the Dukascopy sentiment that you can get here.
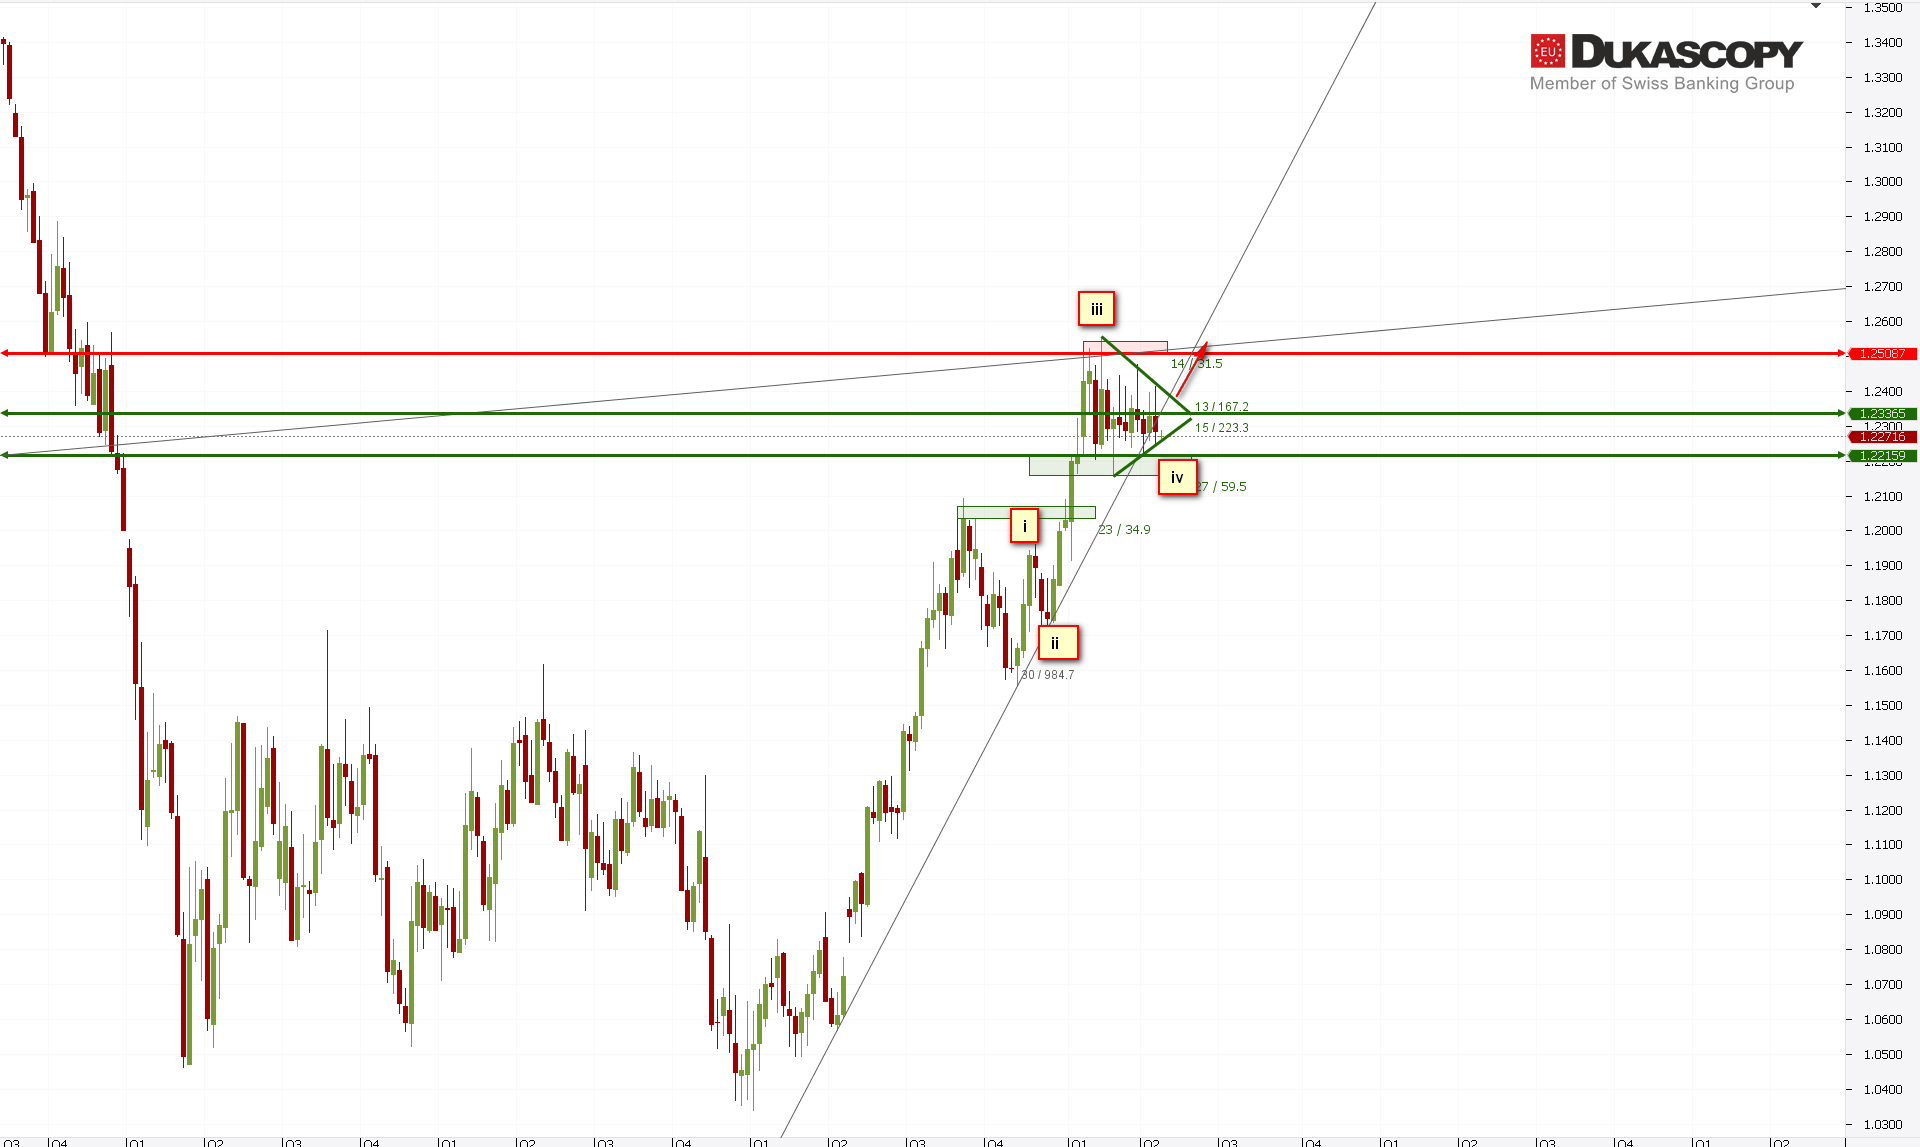
Two months passed when EUR/USD pair started a consolidation, which took the form of a triangle. Looking at the weekly chart of the pair, we can see that this formation should be the fourth wave of the last wave of growth. If so, in the near future we should see another attack on the last highs and it should take place as part of the fifth wave ending the growth impulse. Currently, the pair has reached the lower limit of the triangle and we are waiting for a reaction.
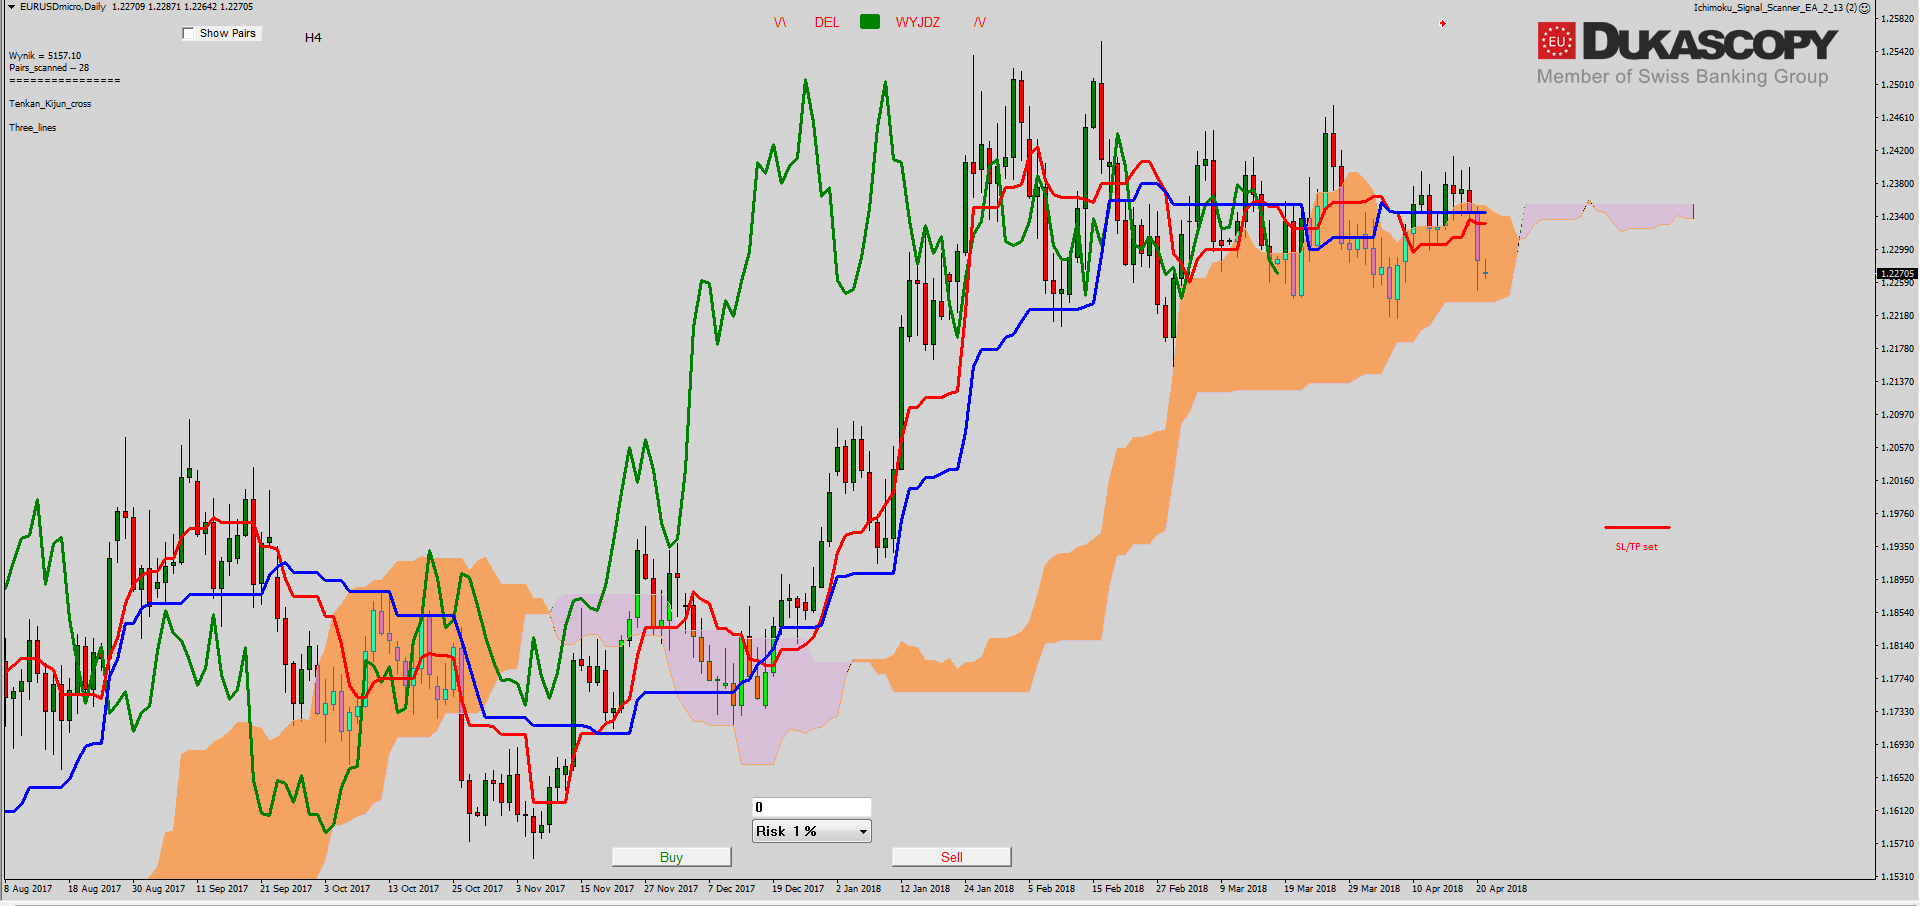
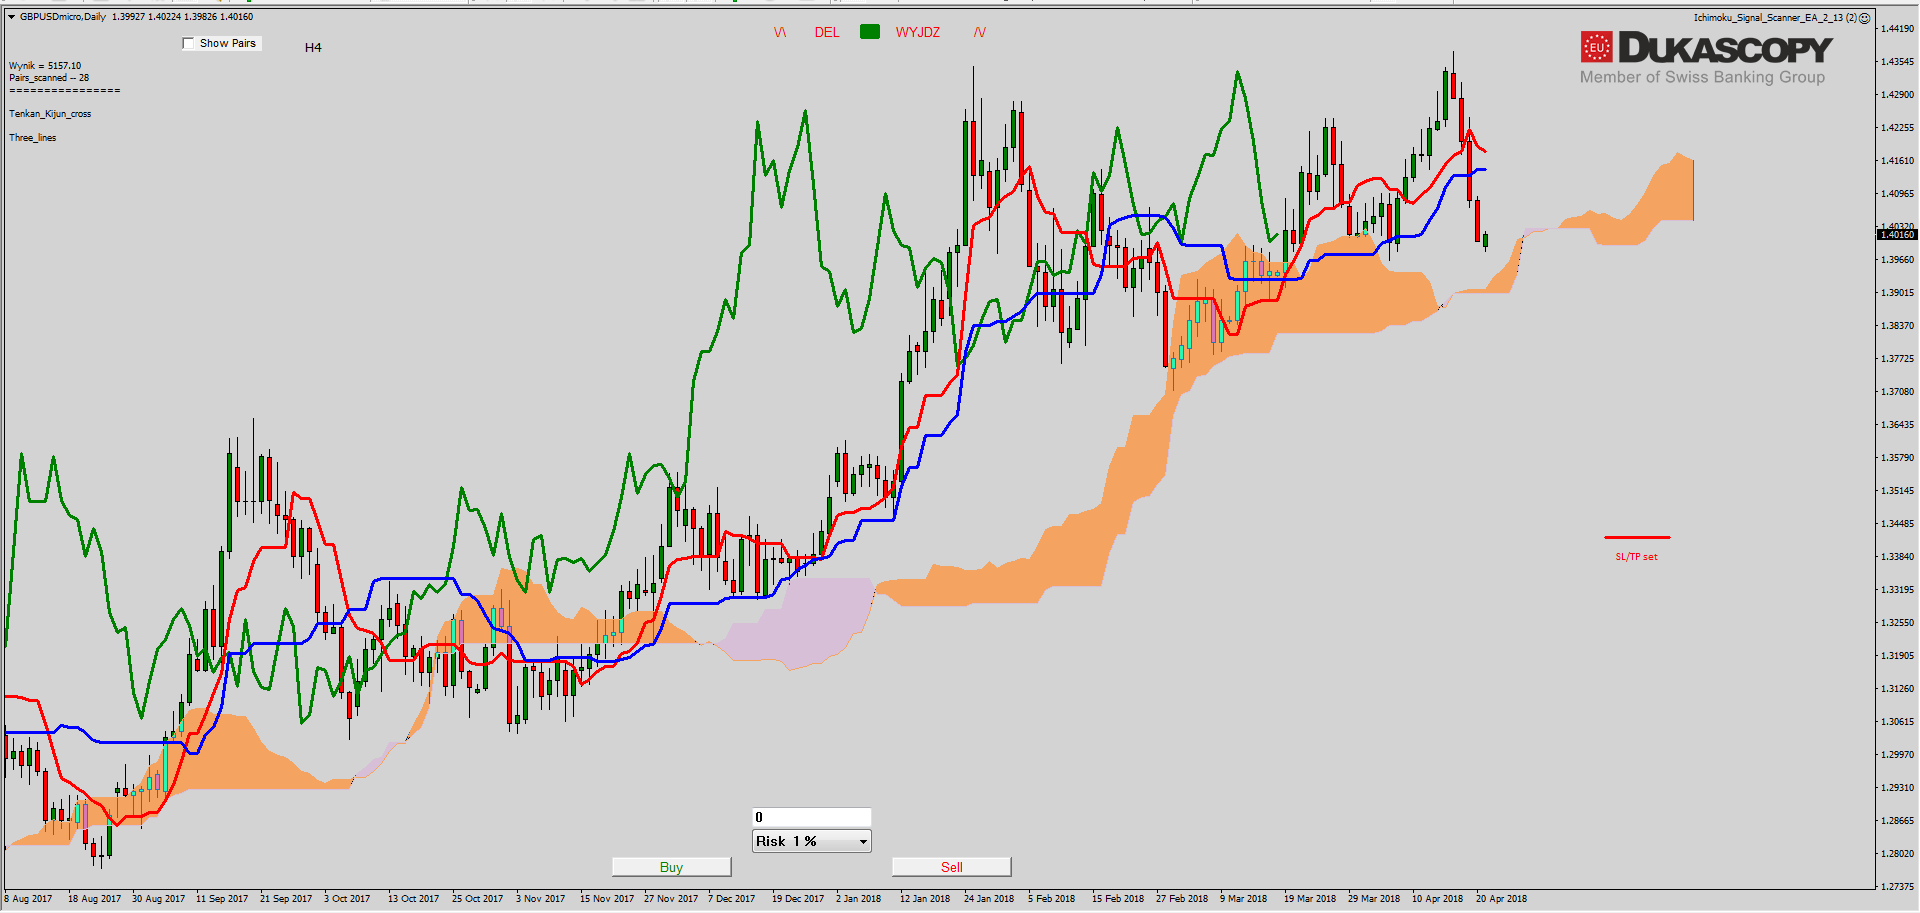
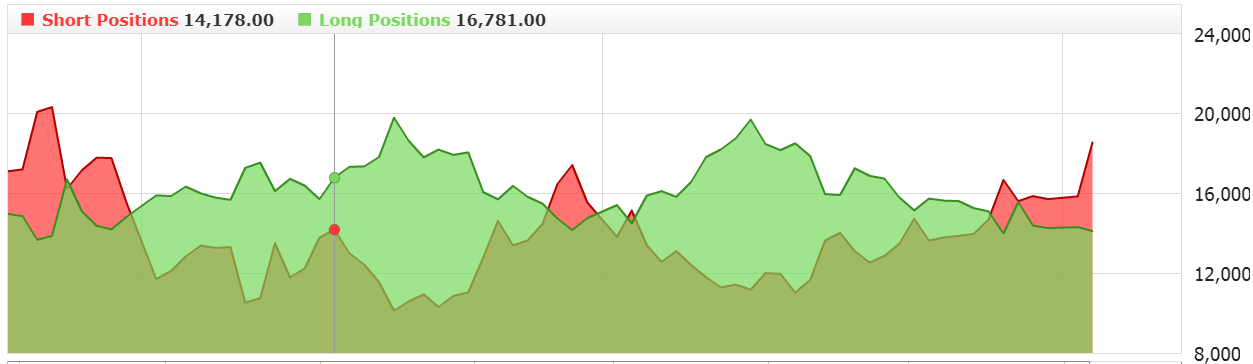
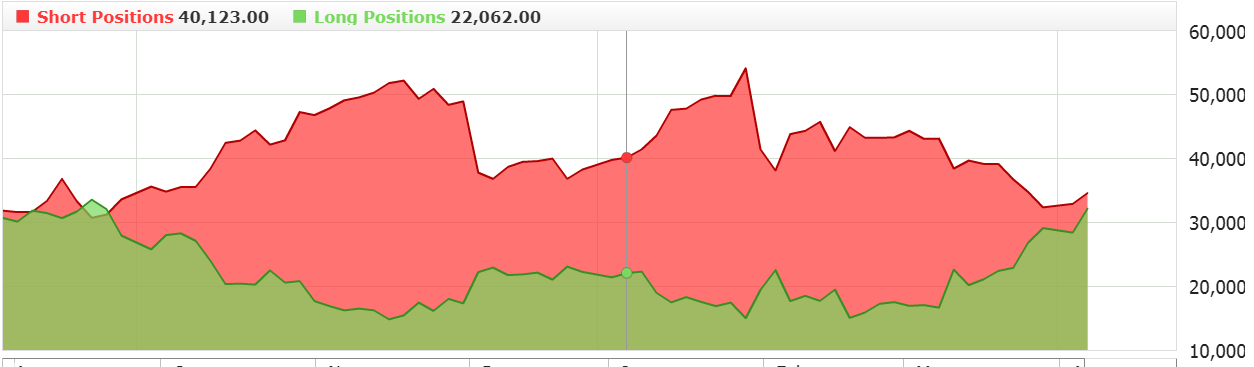 As we can see on the Ichimoku chart, the pair did not manage to stay above the Kijun and Tenkan lines and moved towards Senkou Span A. It is currently in its vicinity. Its test combined with the lower limitation of the triangle should trigger some demand response. This is also favoured by the sentiment on which we have a change. There was an increase in long positions that led to balance. In the event of rejection of the levels I mentioned earlier, we will be able to look for a position for another upward wave.
The partner of “Search, Analyse, Trade” series is a Dukascopy Europe broker who gives its customers access to ECN accounts in different currencies.
Trade on Forex, indices and commodities thanks to Swiss FX & CFD Marketplace. Open free trading account right now.
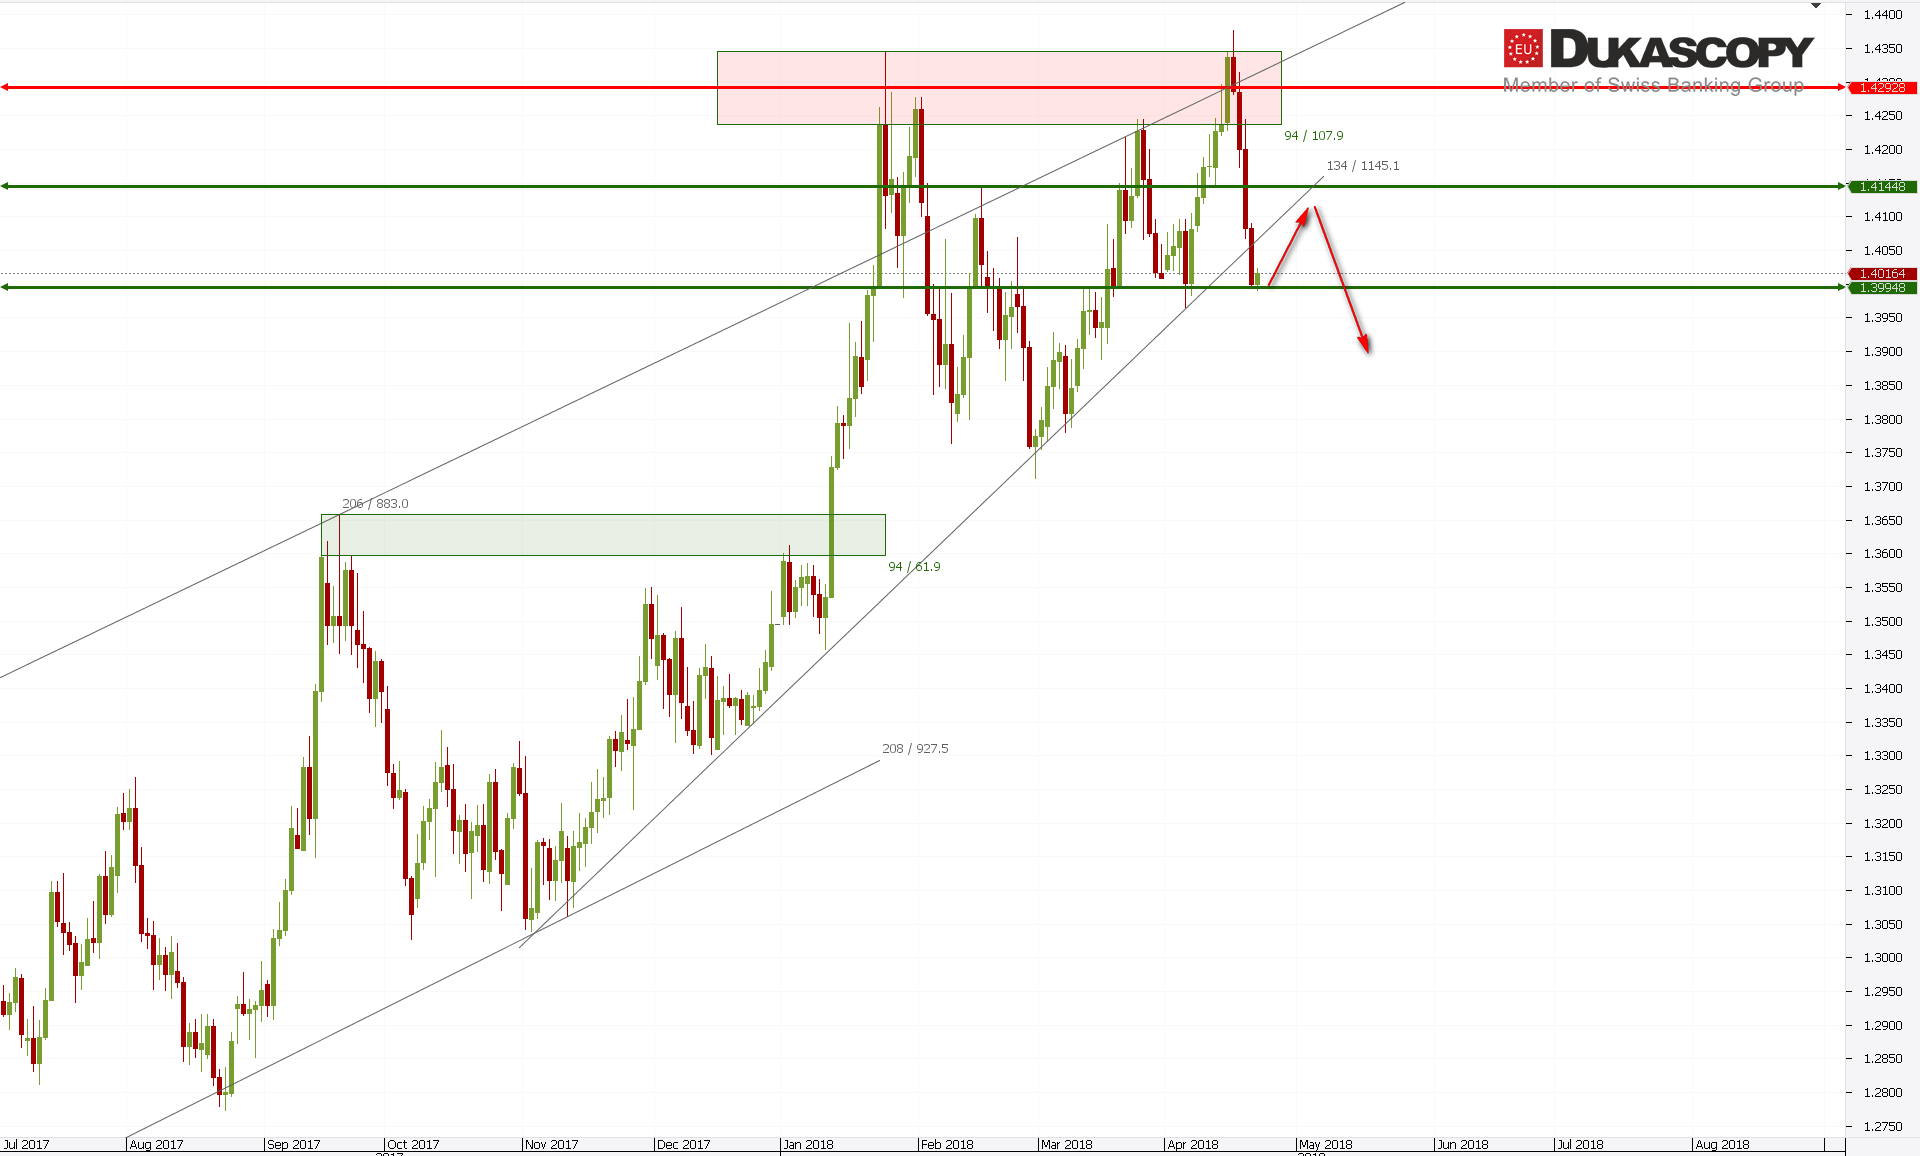
The declines, in case of GBP/USD after rejecting the key resistance zone, has changed into an impulse and should have its continuation. For now, the pair has reached the support zone and it is possible that there will be a demand reaction in this place. Any increases should take place within wave 2B and reach the area of the trend line. After completing them, we should see drops in the 3C wave. The growth scenarios that I’ve presented recently have been negated and we have to wait for the 3C wave to determine what we’re dealing with.
 On the Ichimoku chart, the pair is below the Kijun and Tenkan lines and is slowly heading towards the cloud. Both lines begin to move towards the price, which may lead to their cutting and take a bearish layout. Before the Chikou line, we have a “wire fence” in the form of a price line, Senkou Span A, Tenkan and Kijun. There is a chance that the line will find support on them and we will see a reflection. The sentiment, as it happens in such cases, behaves opposite to expected. The entire fall was used to occupy long positions. This allows you to reduce shorts to open positions on growth, but Ichimoku will not allow it, so I stay on the side.
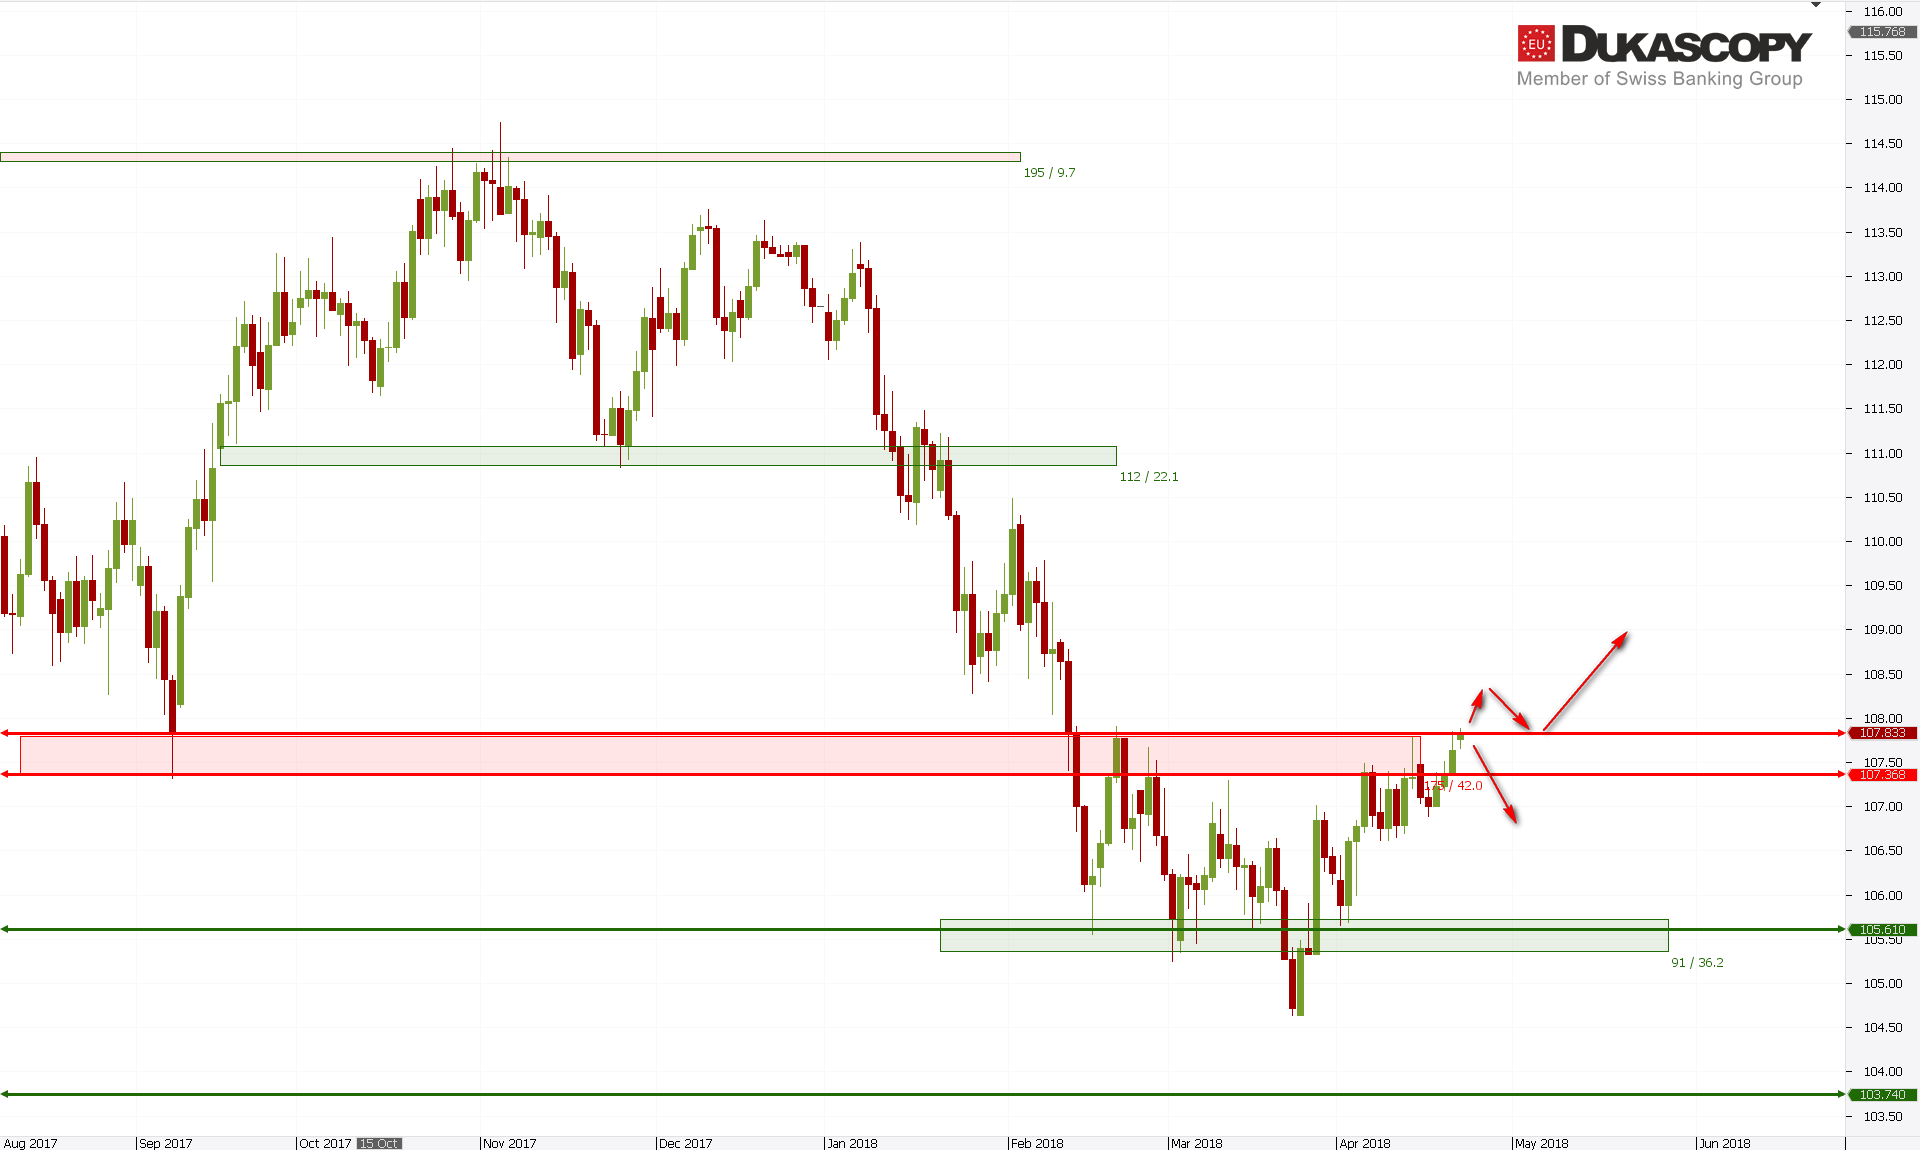
USD/JPY continues to fight near the upper limit of the resistance zone. Since yesterday we see another attack on her. If it succeeds, we should see a strong upward movement towards the nearest resistance and the realization of the formation of the head and shoulders.
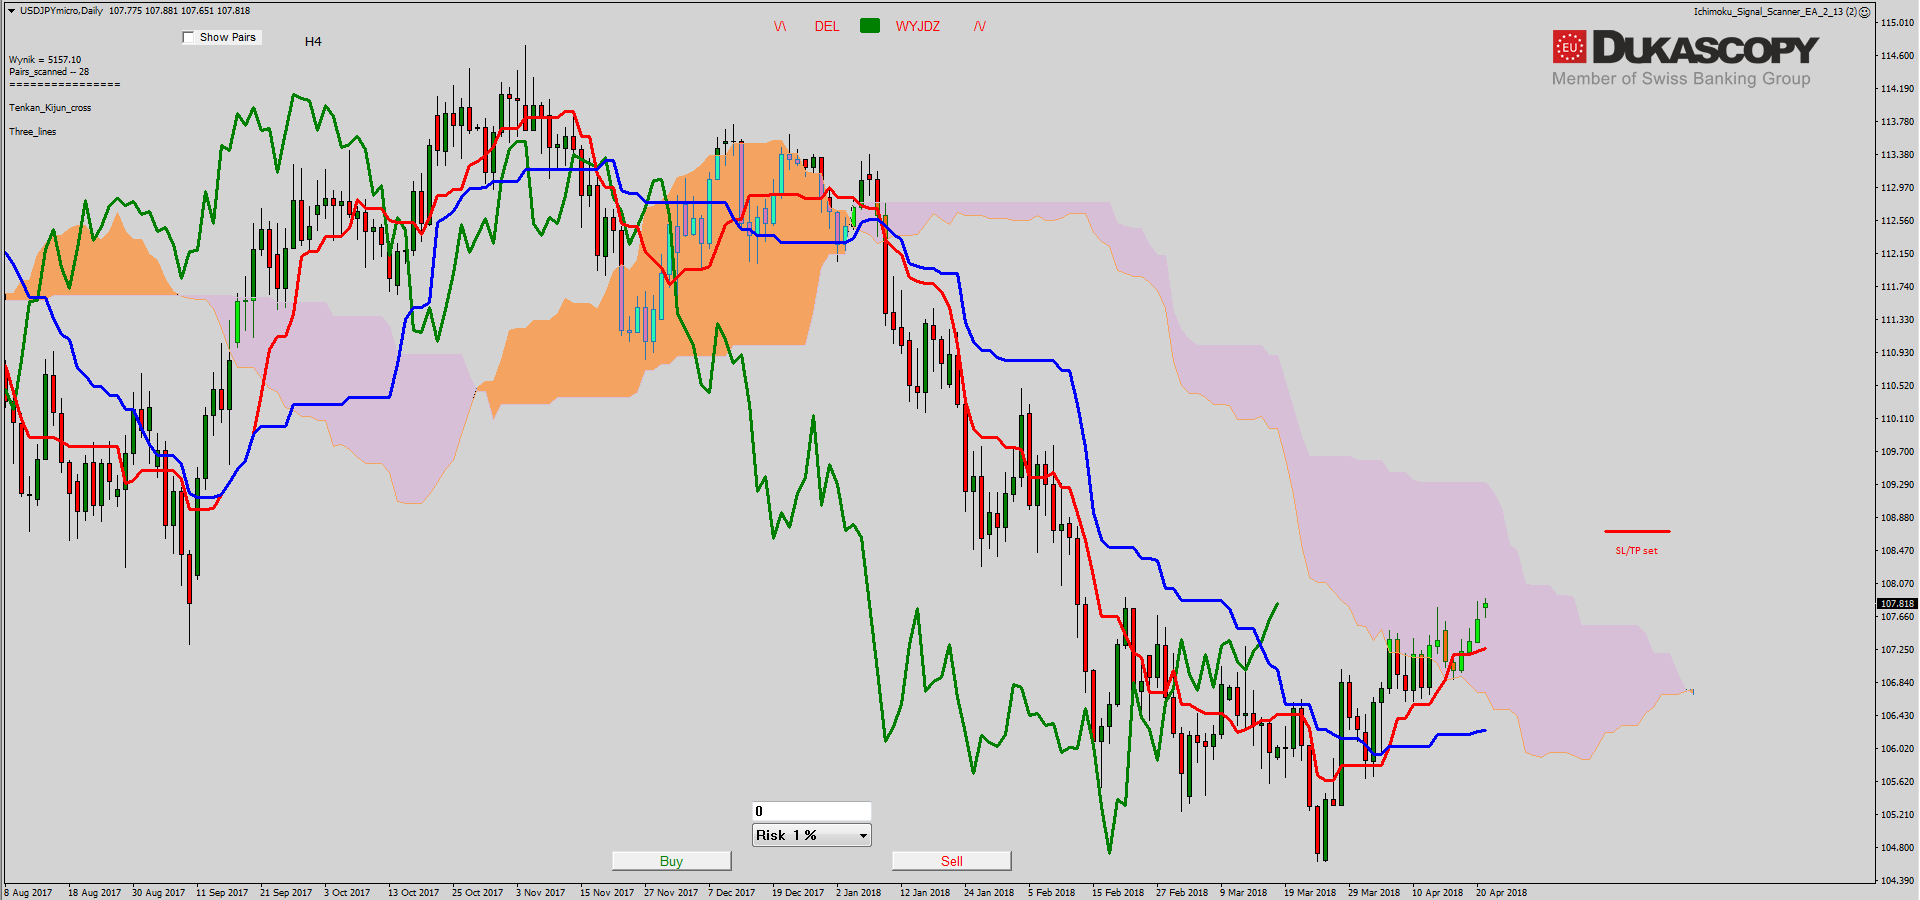
On the Ichimoku chart, we can see that the pair after the Tenkan line rejection continues to increase. The Tenkan line and slowly Kijun begin to follow the price. After defeating Kijun, the Chikou line has a free way up to Senkou Span A. In addition, it moved away from the price, which confirms the growth. If the pair copes with the resistance zone, we can see increases even towards the flat line of Senkou Span B, where the range for wave E falls. The sentiment begins to fall under declines and rejection of the upper limit of the resistance zone. As in the case of GBP/USD, Ichimoku will not allow us to open shorts, which is why only observation is left here.


 Review")


