“Search, Analyse, Trade” is a series of Price Action and Elliott Waves analyses. Its detailed step-by-step description can be found over here. I invite you to today’s review of selected currency pairs and potential trading opportunities. The analyses are based on the Dukascopy sentiment that you can get here.
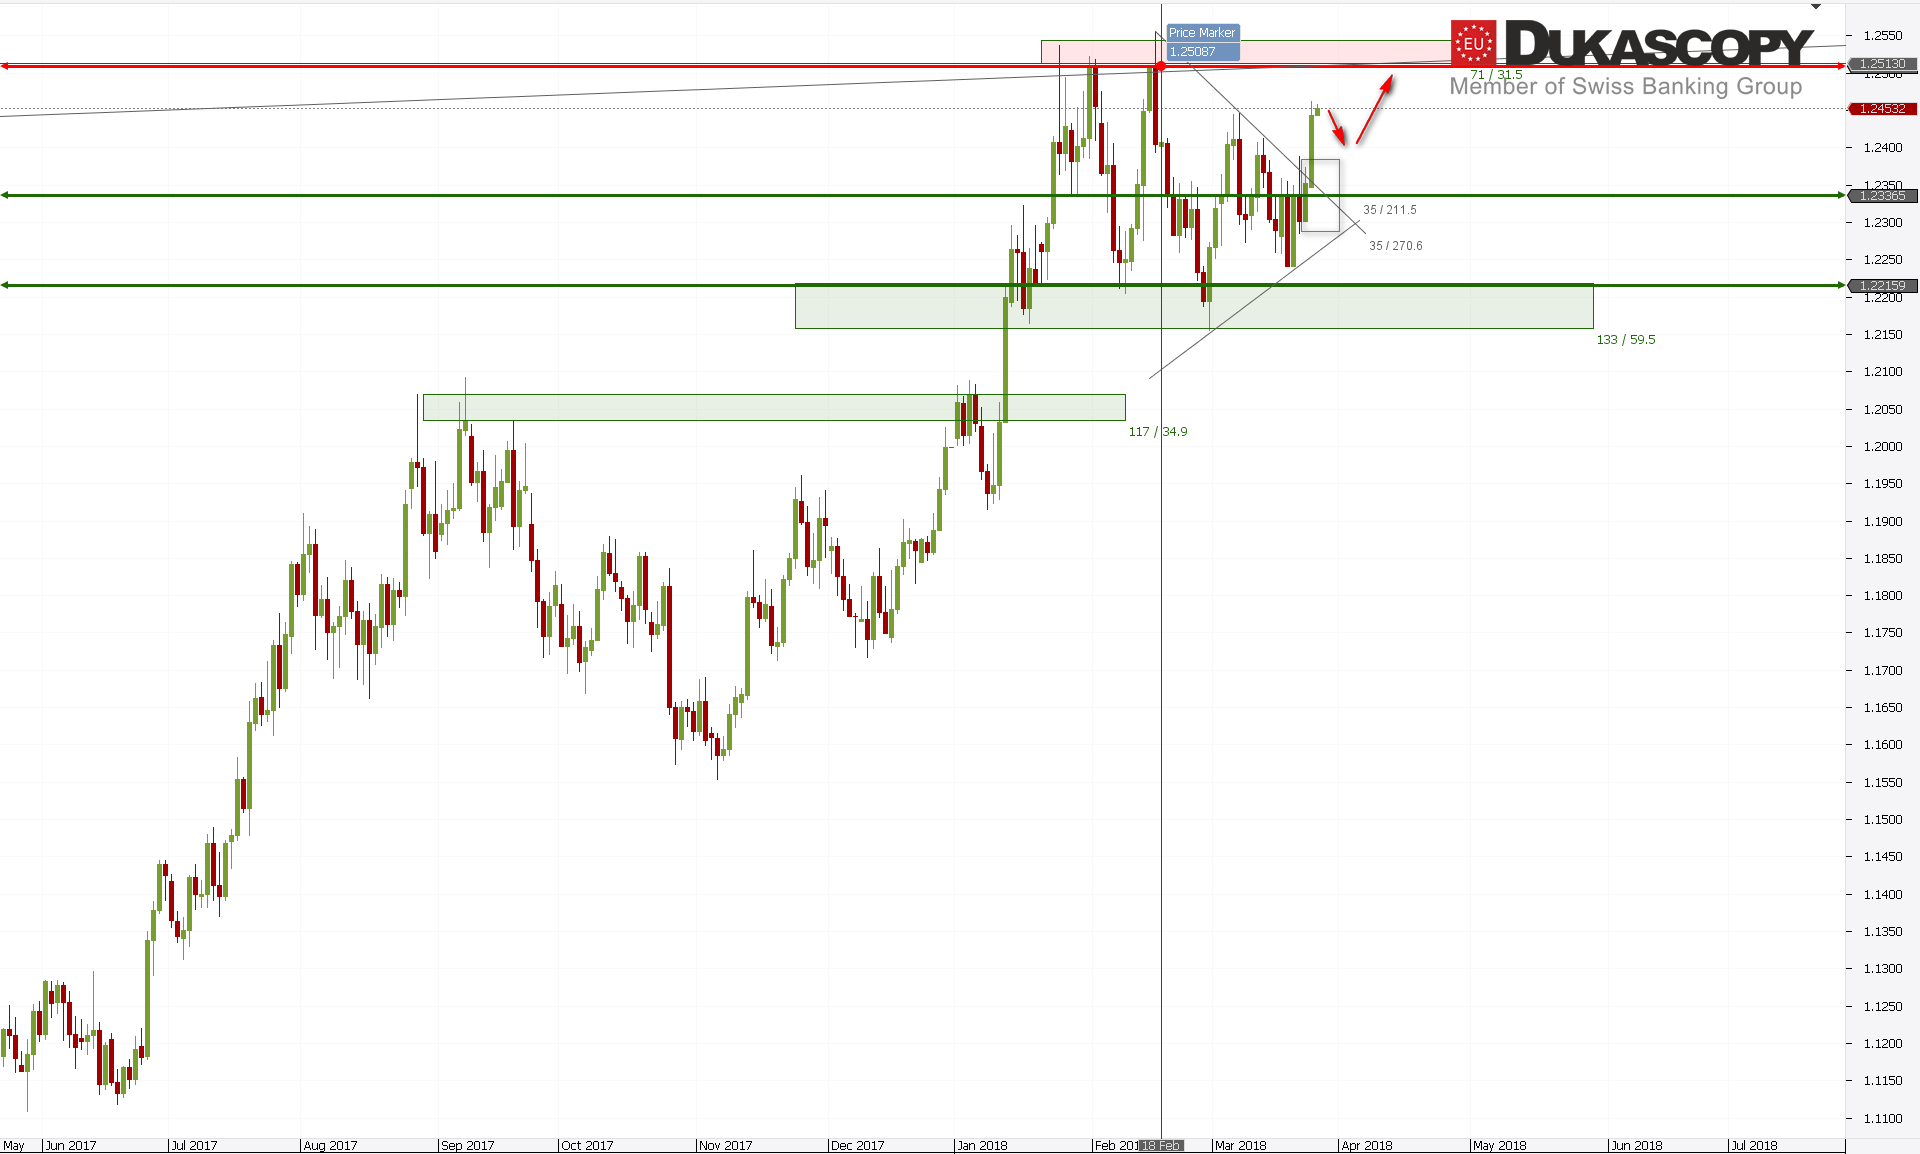
EUR/USD after breaking from the corrective formation and Inside Bar continues to grow. Currently, the pair is testing the inner line of resistance in the form of the wave 1A high. If the whole system is not to be a simple correction ABC of the B wave of declines we have seen from the top, then the level should be defeated. This will open the way to test the key resistance zone. Return to the last resistance zone that has been defeated recently will negate the upward scenario and allow thinking about the beginning of the C wave of the higher order correction or the change of direction in the long run.
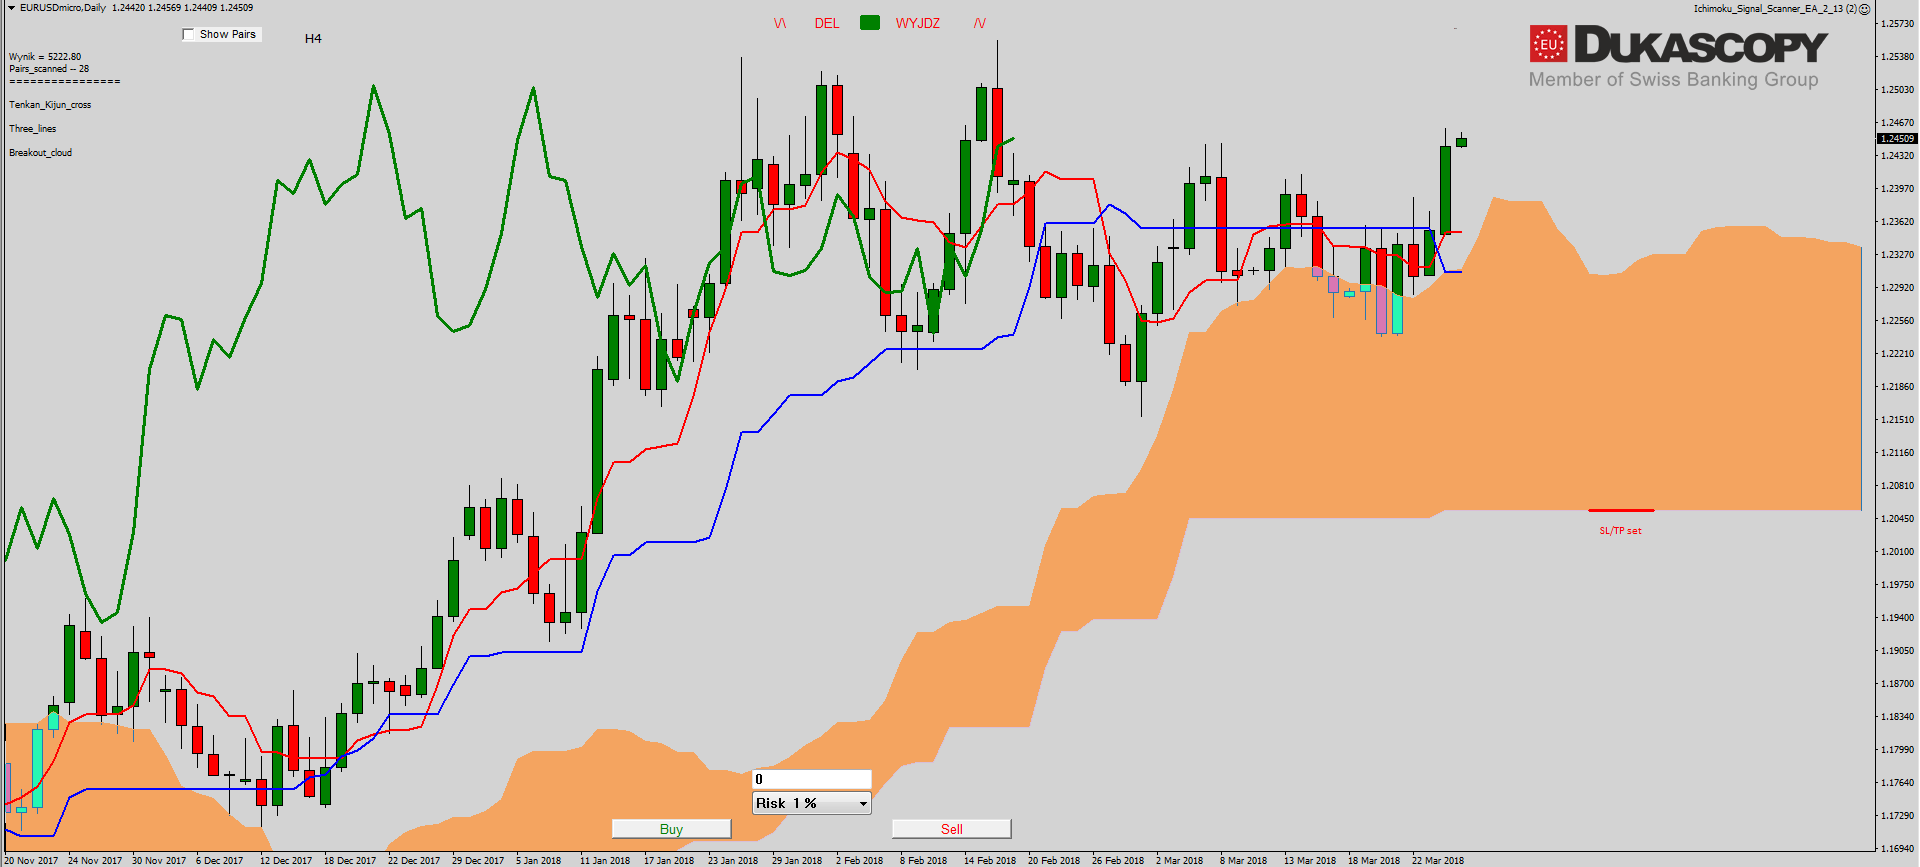 On the Ichimoku chart, the pair after rejection of Senkou Span A defeated the Kijun line, which may suggest a willingness to continue growing. The Kijun and Tenkan lines have crossed, but are still in a neutral position. The Chikou line is slowly rising over the price, which may also suggest the end of consolidation.
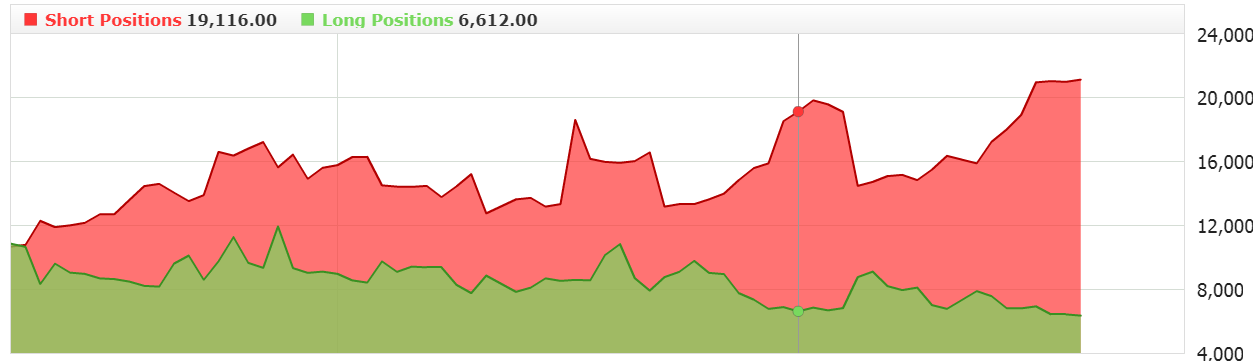
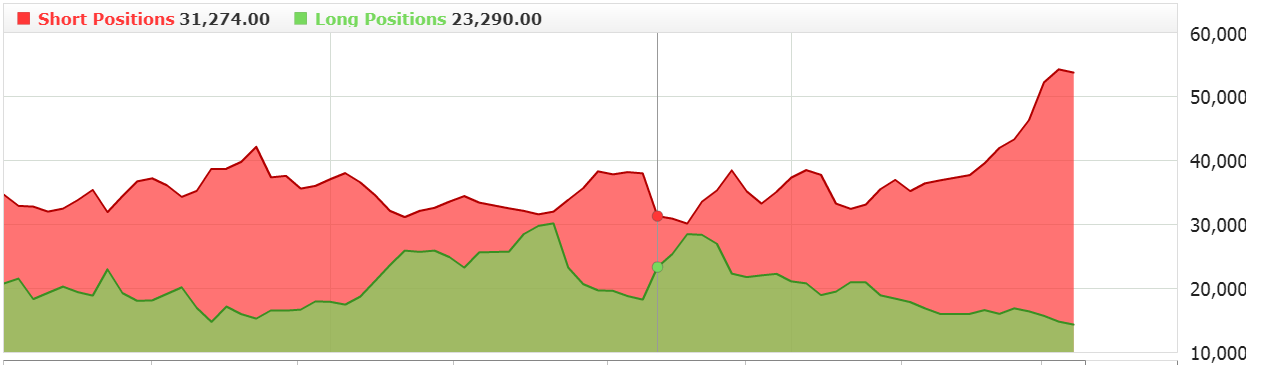 We have very big changes in sentiment and not only on this pair, but also on the others. We see a rapid increase in short positions with a simultaneous reduction of long ones. If the pair manages to reach and defeat the key resistance zone, we can see a strong growth driven by closing the shorts being opened.
The partner of “Search, Analyse, Trade” series is a Dukascopy Europe broker who gives its customers access to ECN accounts in different currencies.
Trade on Forex, indices and commodities thanks to Swiss FX & CFD Marketplace. Open free trading account right now.

GBP/USD after breaking the internal resistance zone a few days ago, continues to increase. Currently, the pair is again testing the upper limit of the previous growth channel. The candle that had previously rejected the line was negated. The level at which the pair is currently located is also the lower limit of the key resistance zone. Its overcoming should lead to the upper limit test and there it will be decided if the trend will continue, or we will see its rejection and return to consolidation or change of trend.
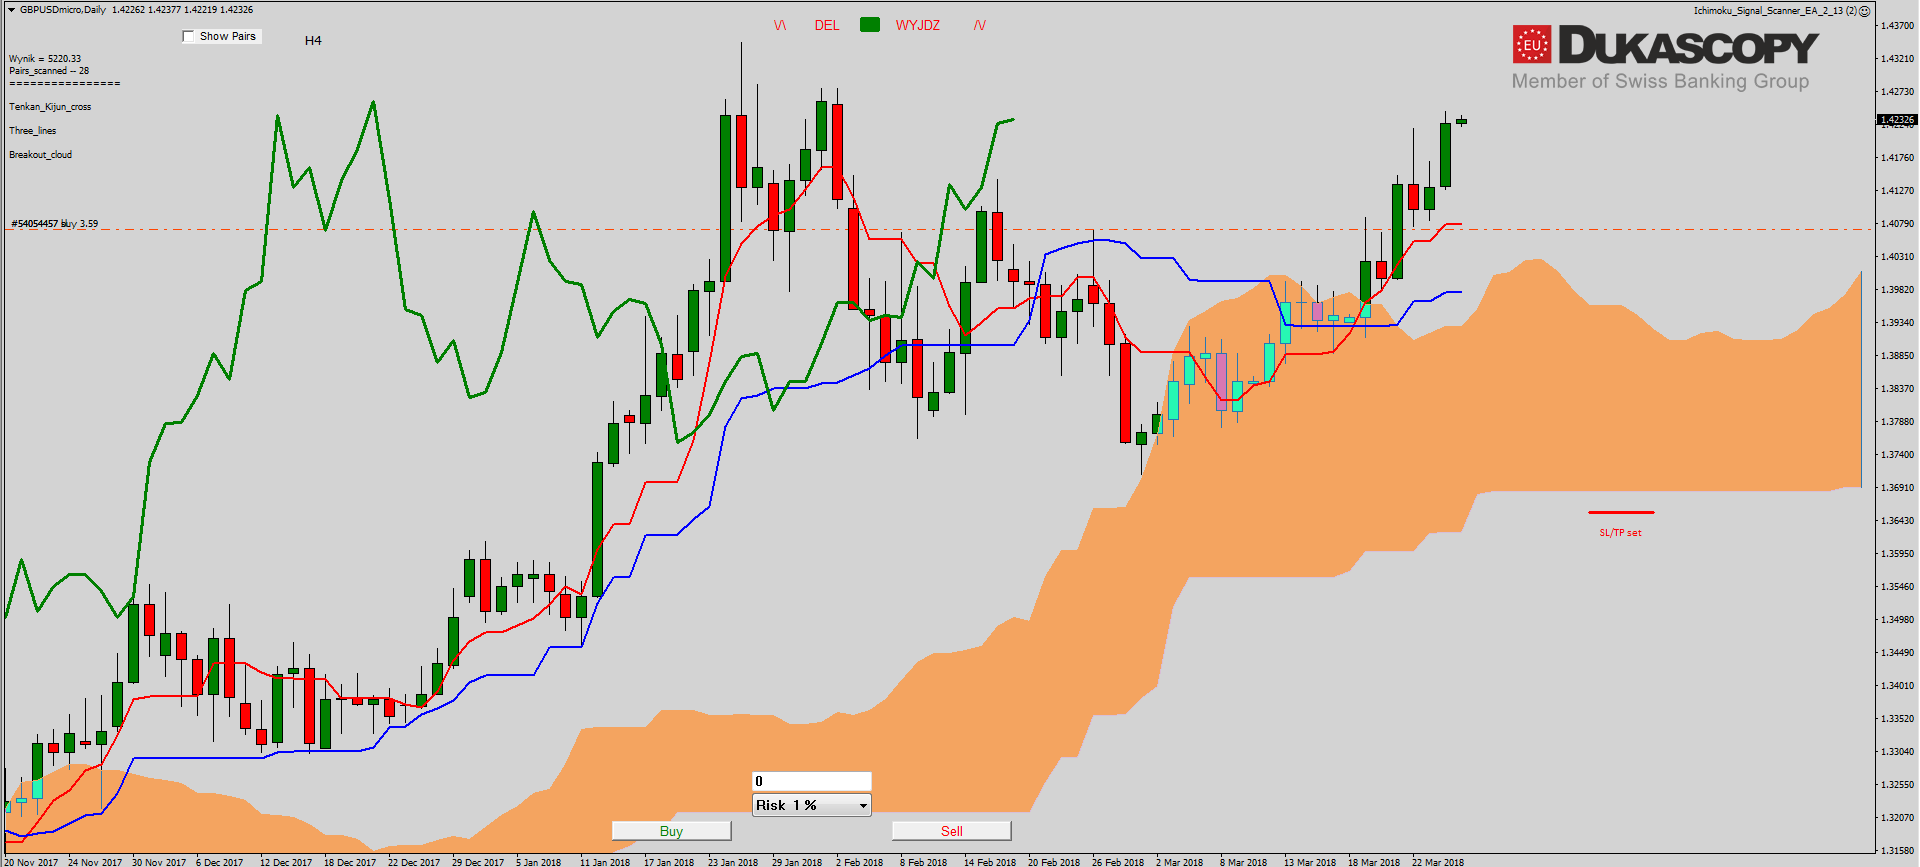
The outlook of Ichimoku begins to look more and more bullish. Tenkan and Kijun lines after the earlier intersection begin to follow the price. Similarly, the Chikou line, which clearly went above the price and again deviated from the price at a suitable distance. Each re-test of the Tenkan line can be used to look for a long position.
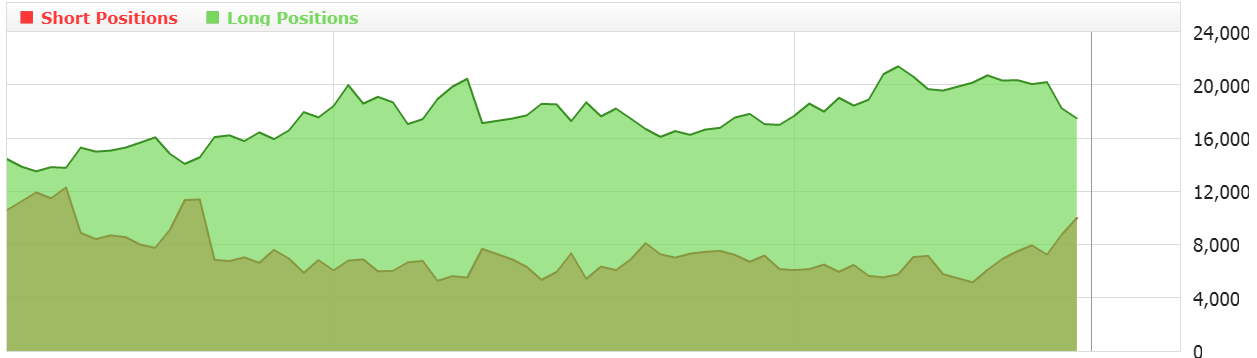
 In my case, however, the sentiment, which like on the EUR/USD pair is becoming very bearish, does not allow to open position.
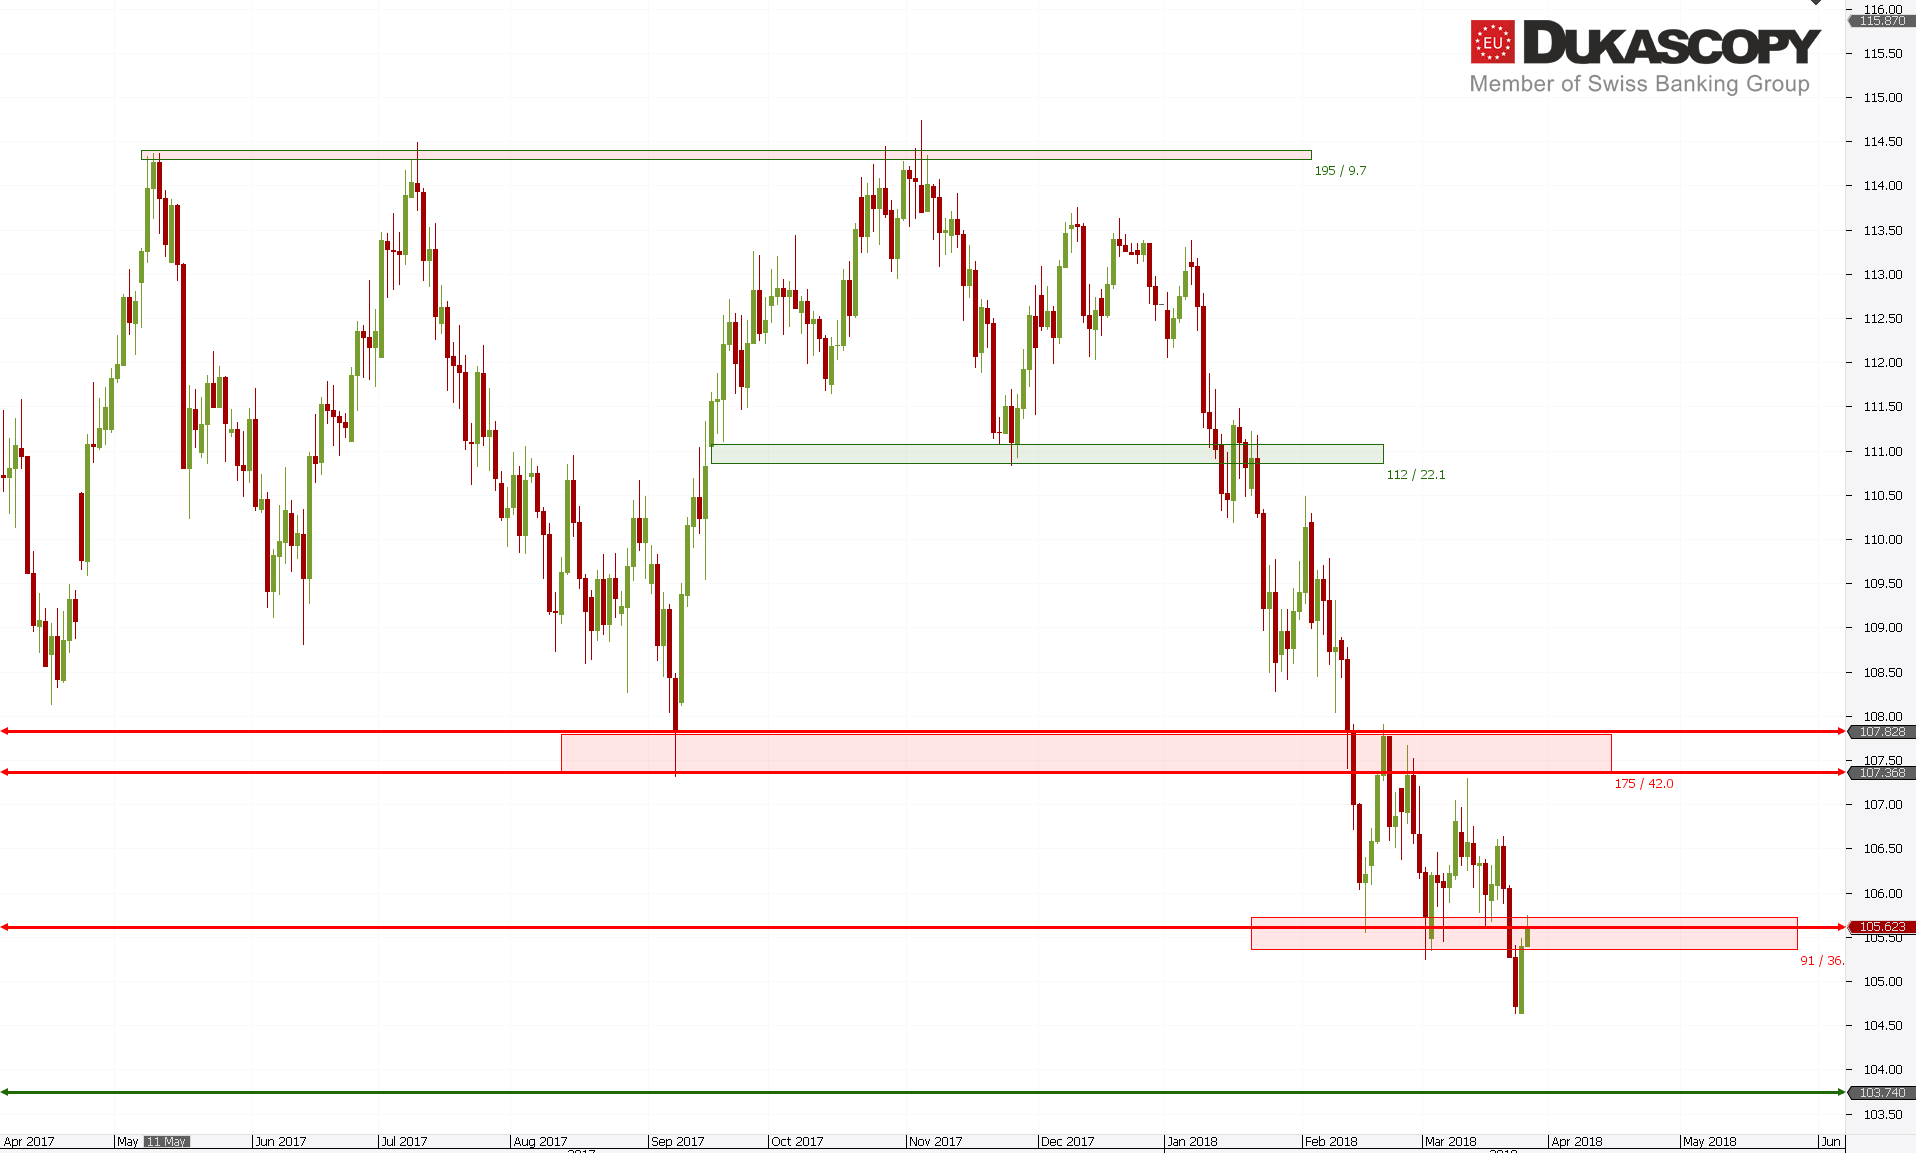
USDJPY has reached the level of support drawn on the weekly chart. The Outside Bar was formed and the pair reached the recently defeated support zone, now resistance. The last downside segment is a three and one can expect two scenarios. The first assumes that now the pair is testing the low of the second wave of the two and after rejecting it, we will see drops in the fift wave. In the second scenario, the mentioned three is the B wave of the irregular correction. In this case, the pair should beat the tested zone and we will see bigger increases in the C wave.
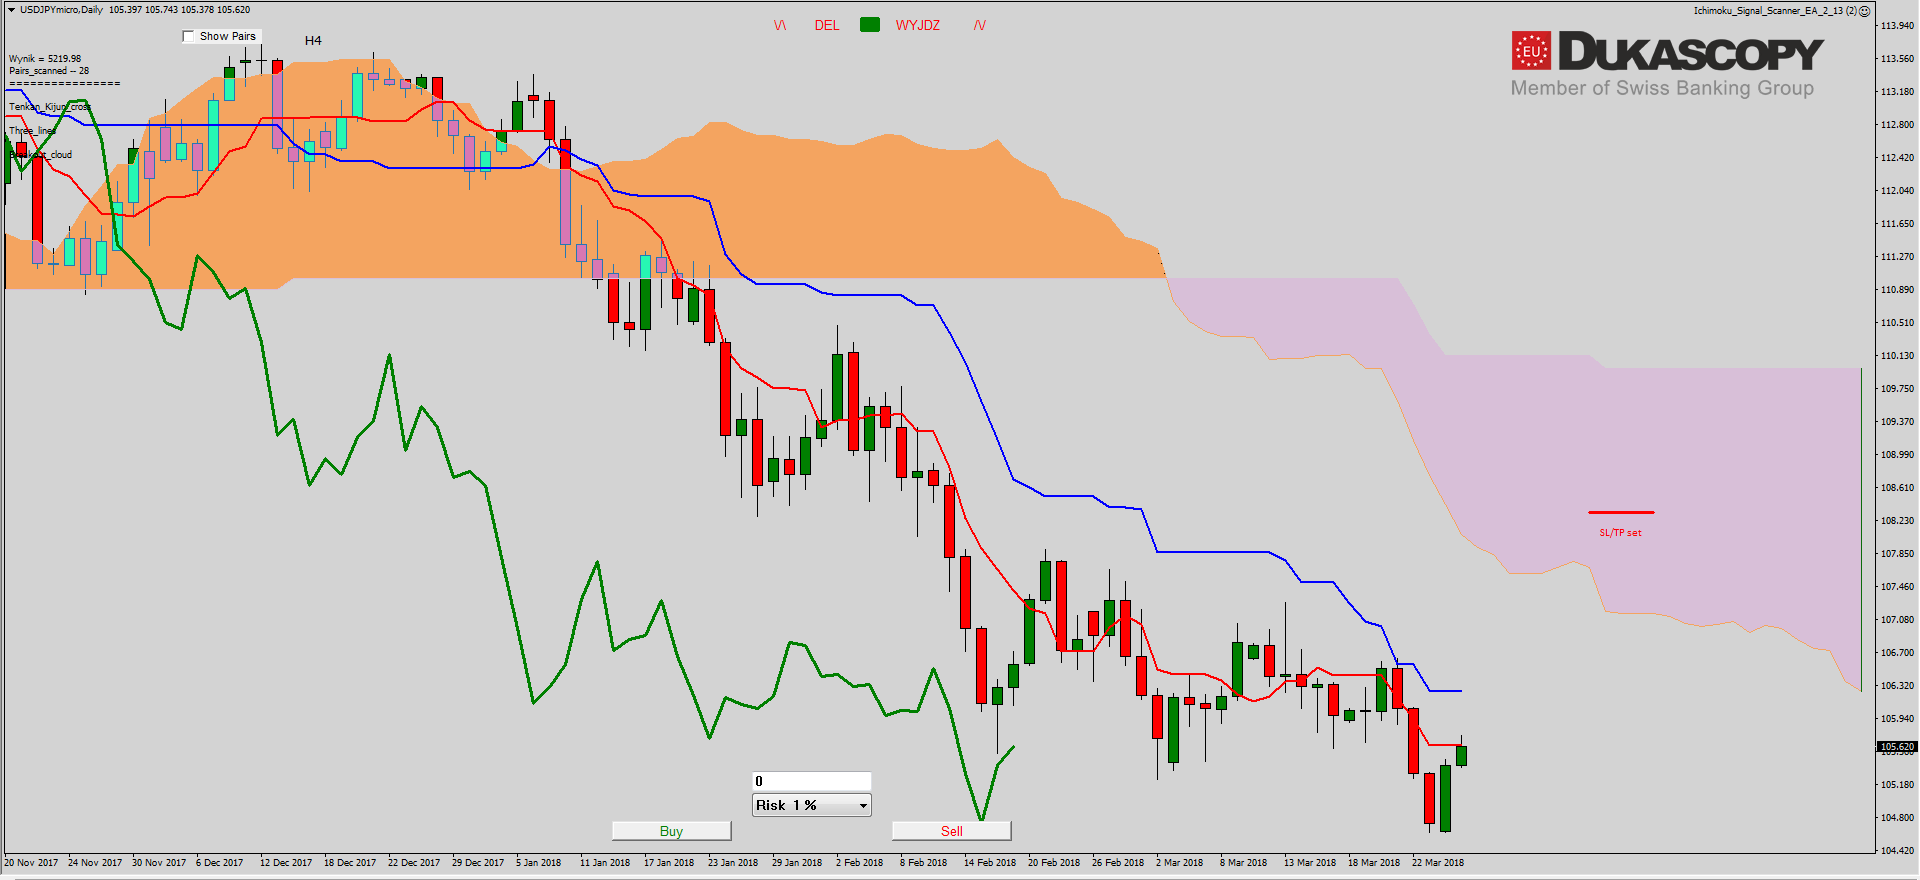 On the Ichimoku chart, we see that the pair reached the Kijun line during the consolidation and rebounded from it. A new downward trend was created. The increases that appeared after the rejection of the support line allowed us to return to the Tenkan line, which is currently being tested. Both the Tenkan and Kijun lines are currently moving flat, which may suggest prolonged consolidation. This is also suggested by Chikou, which is approaching the price more and more, signalling the weakening of the trend.


 Review")


