S&P500 is a stock exchange index which includes 500 companies with the largest capitalization, listed on the New York Stock Exchange and NASDAQ. These are mainly American companies.
Using Technical Analysis to predict future movements on stock exchange indices does not always prove to be effective, because is it possible to predict the financial condition of 500 companies based on the history of quotations, and TA is mainly using historical data shown on charts?
Despite these doubts, I will try to apply TA and indicate the direction for the upcoming sessions, and in a few days we will see if it made sense.
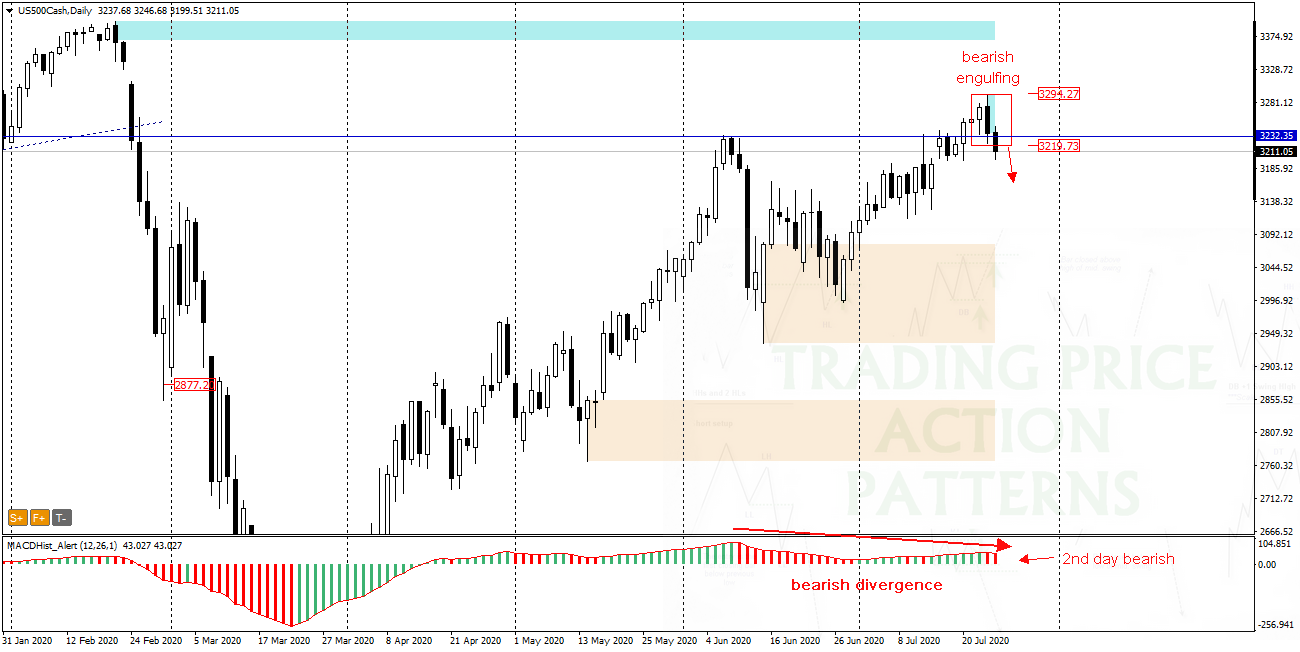
Last Thursday’s on daily chart a bearish engulfing pattern was created and on Friday the quotations hit the bottom of its range. The breakout from the formation is accompanied by bearish divergence on MACD. According to the assumptions of the PA+MACD strategy, this is a signal for declines.
Visit my channel where I post trading ideas: https://t.me/TradewithDargo
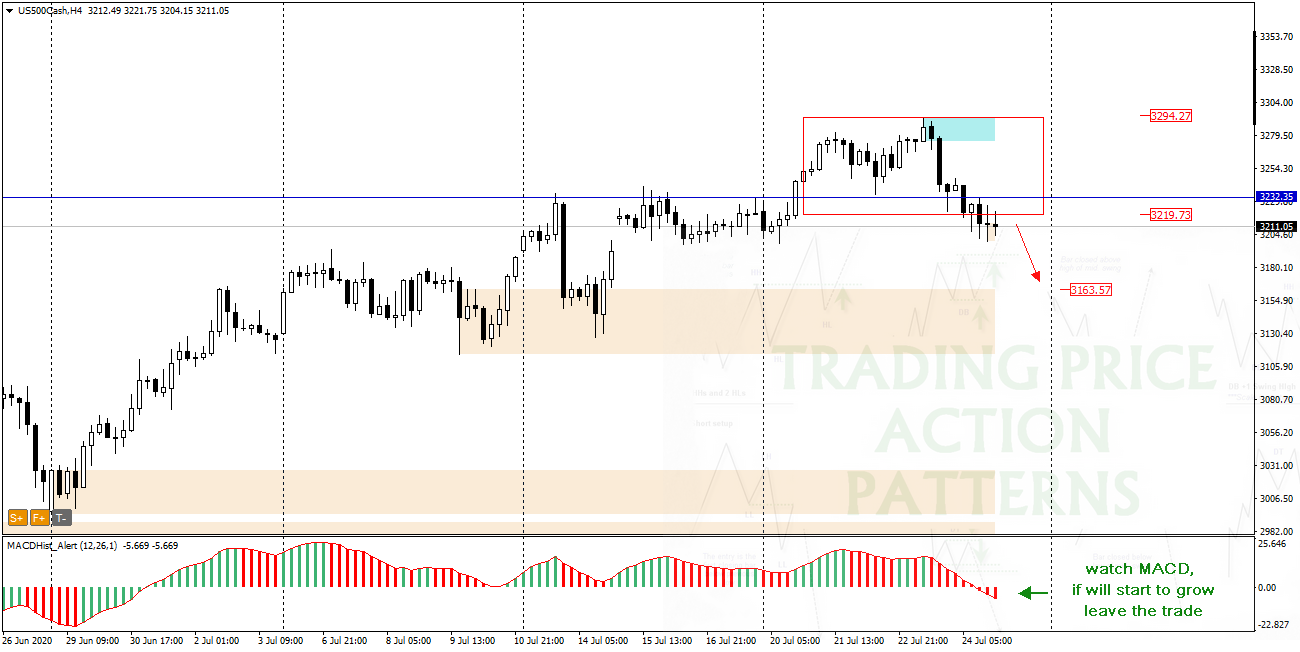
To determine the range of possible declines you can look at the four-hour chart H4. Here the closest supply target may be the demand zone starting at 3160 points.
In case of opening a short position, it is worthwhile to observe the MACD when there are first signs of a change in the sentiment to bullish (green) – close the position.
 In our Facebook group, which you can join anytime: https://www.facebook.com/groups/328412937935363/ you will find 5 simple strategies on which my trading is based. There, every day we post fresh analyses of currency pairs and commodities. You can also visit my channel where we can post our trading ideas: https://t.me/TradewithDargo


 Review")


