The pair of the New Zealand dollar with the US dollar (NZDUSD) has recently moved in a strong upward trend.
In March, as the stock exchanges have been declining, NZD has also been losing ground, and it is enough to look at the SP500 and NZDUSD chart to see that there is a positive correlation between these instruments.
Since the minimum of 0.5460 this year, the price has already risen by 1230p to 06690.
Visit my channel where I post trading ideas: https://t.me/TradewithDargo
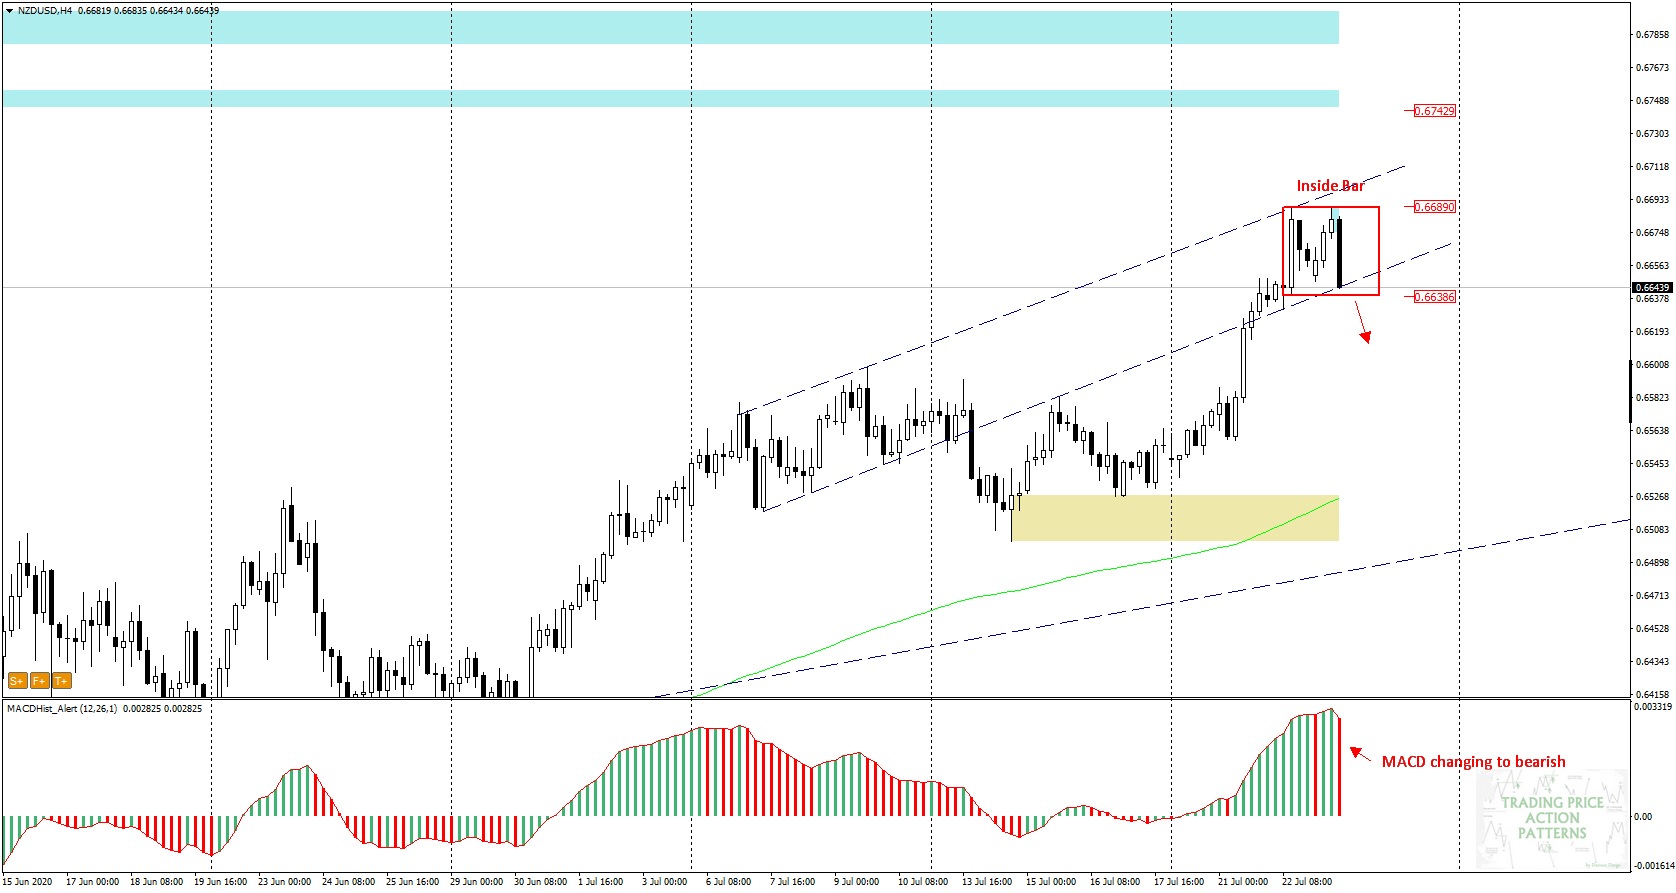
Today the Inside Bar formation appeared on the chart with a range of 0.6690-0.6540.
As we are writing this analysis the price is breaking down from the formation, at the same time the MACD has created a maximum and starts falling (red).
Everything indicates that the declines will continue. A good support for this scenario will be to change to a “red” MACD on the day chart, but we will only see if this is the case when the daily candle closes.
 In our Facebook group, which you can join anytime: https://www.facebook.com/groups/328412937935363/ you will find 5 simple strategies on which my trading is based. There, every day we post fresh analyses of currency pairs and commodities. You can also visit my channel where we can post our trading ideas: https://t.me/TradewithDargo


 Review")


