In the past week I published two analyzes, so let’s see how the market verified them, whether we were able to predict the future of the two currency pairs USDJPY and NZDUSD.
Monday, 19 November – USDJPY – are we leaving the growth channel?
As in the title, I predicted that the pair will leave the uptrend and there will be declines – “… the dynamics of recent declines and the fact that the MACD on the Daily and H4 graph decreases suggests that a break from this consolidation may occur and continuation of declines initiated at the end of last week, and their immediate goal may be the demand zone 112.10. “
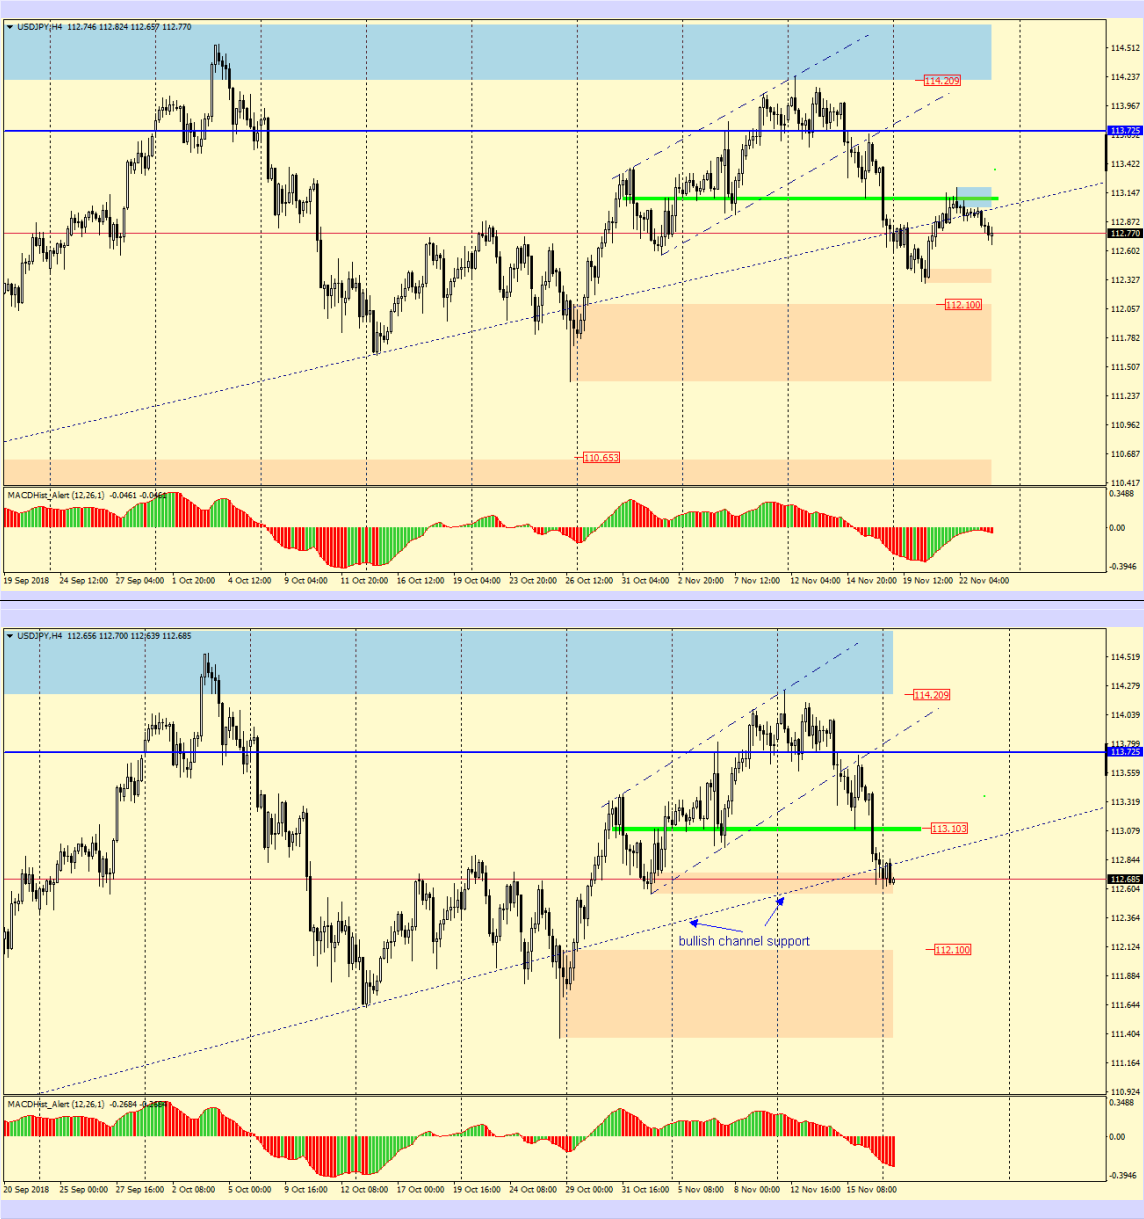
Analyzing this pair, I also tried a fairly detailed description of how to plan a sell order, where I would set a Stop Loss and plan a Take Profit.
Among other things, I wrote: – “When planning a sell order, we need to analyze the graph at a lower interval to determine the potential Take Profit, Stop Loss and market entry.
The green zone defeated on Friday worked 5 times as support earlier and now most likely it can become a local resistance, which is why the SL level should be above it.” It turned out that the mentioned zone withstood the pressure of buyers and SL proved to be safe.
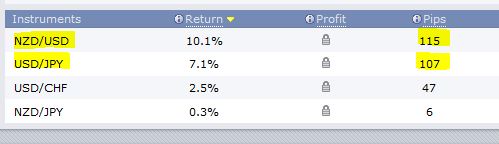
I benefited from the initial decreases and collected a total of over 100p. There was another opportunity to sell on Wednesday because the intersection of EMA144 with the resistance zone took place – “It is also worth paying attention to the average EMA144, it was respected at H1 as a dynamic support for the price and after defeating it twice as resistance. Perhaps it will be a good place in its area for our sell order, and even better if the green zone and the aforementioned average created a confluence of resistance or simply have crossed. “
Treating this as another confirmation of the strength of this resistance, today I opened another sell with the hope of reaching the original goal of supporting 112.10
Wednesday, 21 November – NZDUSD – Inside Bar and falling MACD
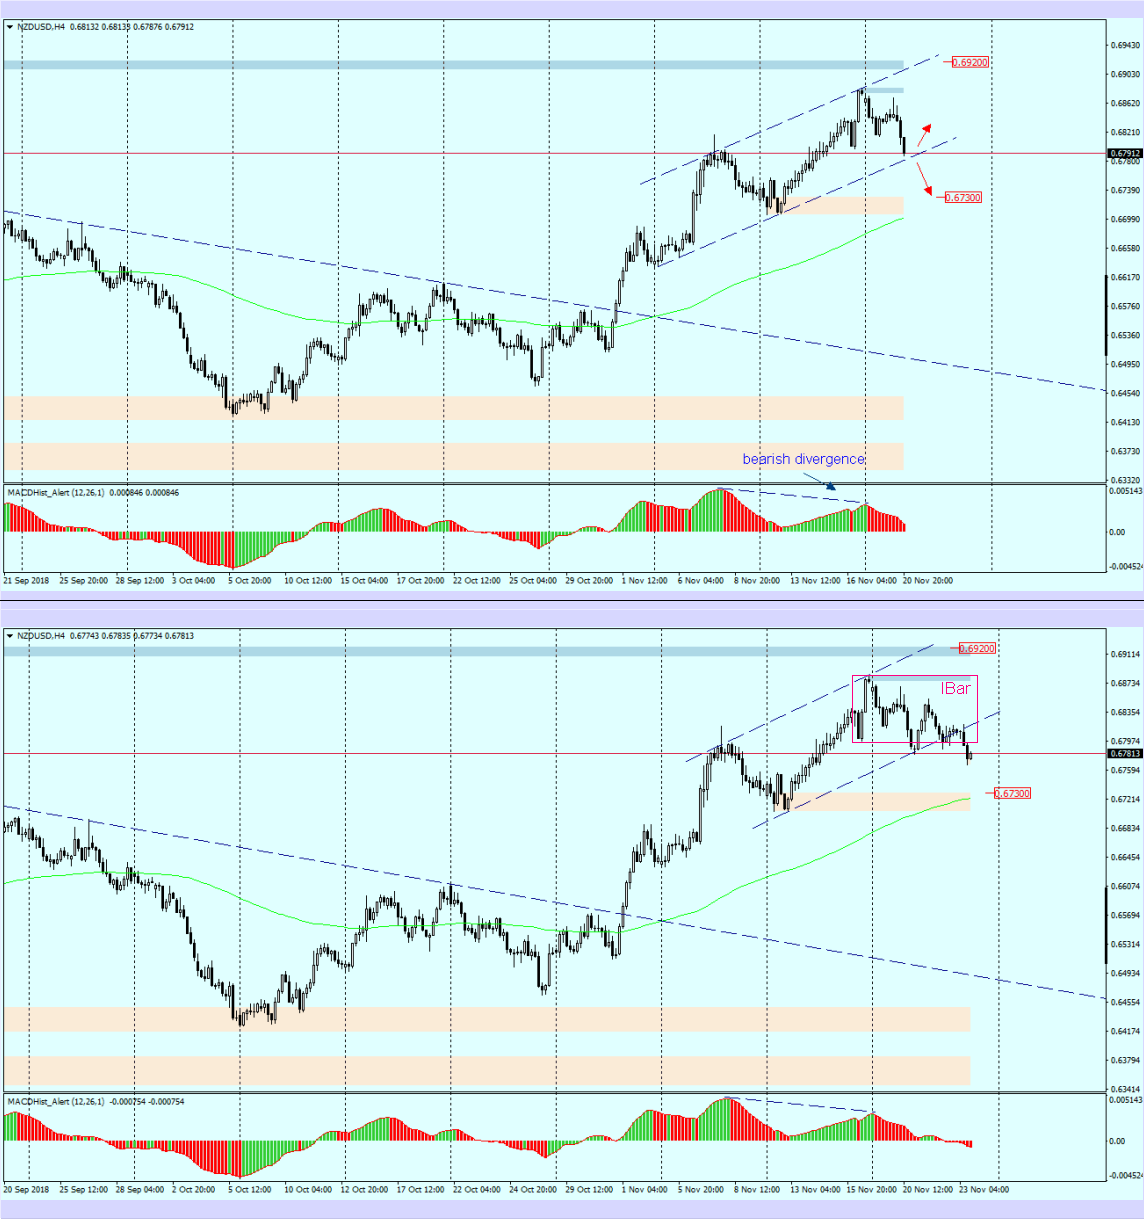
I will quote here a fragment of the analysis that explains the situation on the chart: -This week (chart D1), Monday’s quotations were within range of the preceding day candle from Friday, creating the formation of Inside Bar. Today the lower IB limit has been slightly overcome and the daily candle has created the maximum on the MACD oscillator. This may herald further declines. When we look at the H4 chart, we notice that from the beginning of this month the quotes moved in a growth channel. Overcoming its lower limit (channel support) will open the way to the nearest support at 0.6730
Ongoing bearish divergence supports the downward trend.”
The forecast worked well, the price after the initial attempt to rebound from the support of the channel reached around 50% of the IBar and returned to declines. What is worth attention in the coming days: the price has not yet reached the mentioned level of support 0.6730, it will be worth to sell again after a pullback.
Based on the published analyzes, I collected 222 p.


 Review")


