Last week I analyzed three currency pairs: USDJPY, USDCHF and AUDUSD. The first two pairs, according to the principles of Price Action and its basic formations, and the last one in a slightly different way, namely I used the envelopes indicator, which was supposed to show me the nearest future of quotations on this pair. What worked and what didn’t, is described in the next, already 43rd weekly article from the cycle “When Theory Meets Practice”.
The analysis that appeared on Monday, as the title indicates: “USDJPY and USDCHF – possible further strengthening of Yen and Frank” concerned two pairs and on both pairs I predicted falls. The charts below show that I was not mistaken and the fortune-telling worked in both cases.
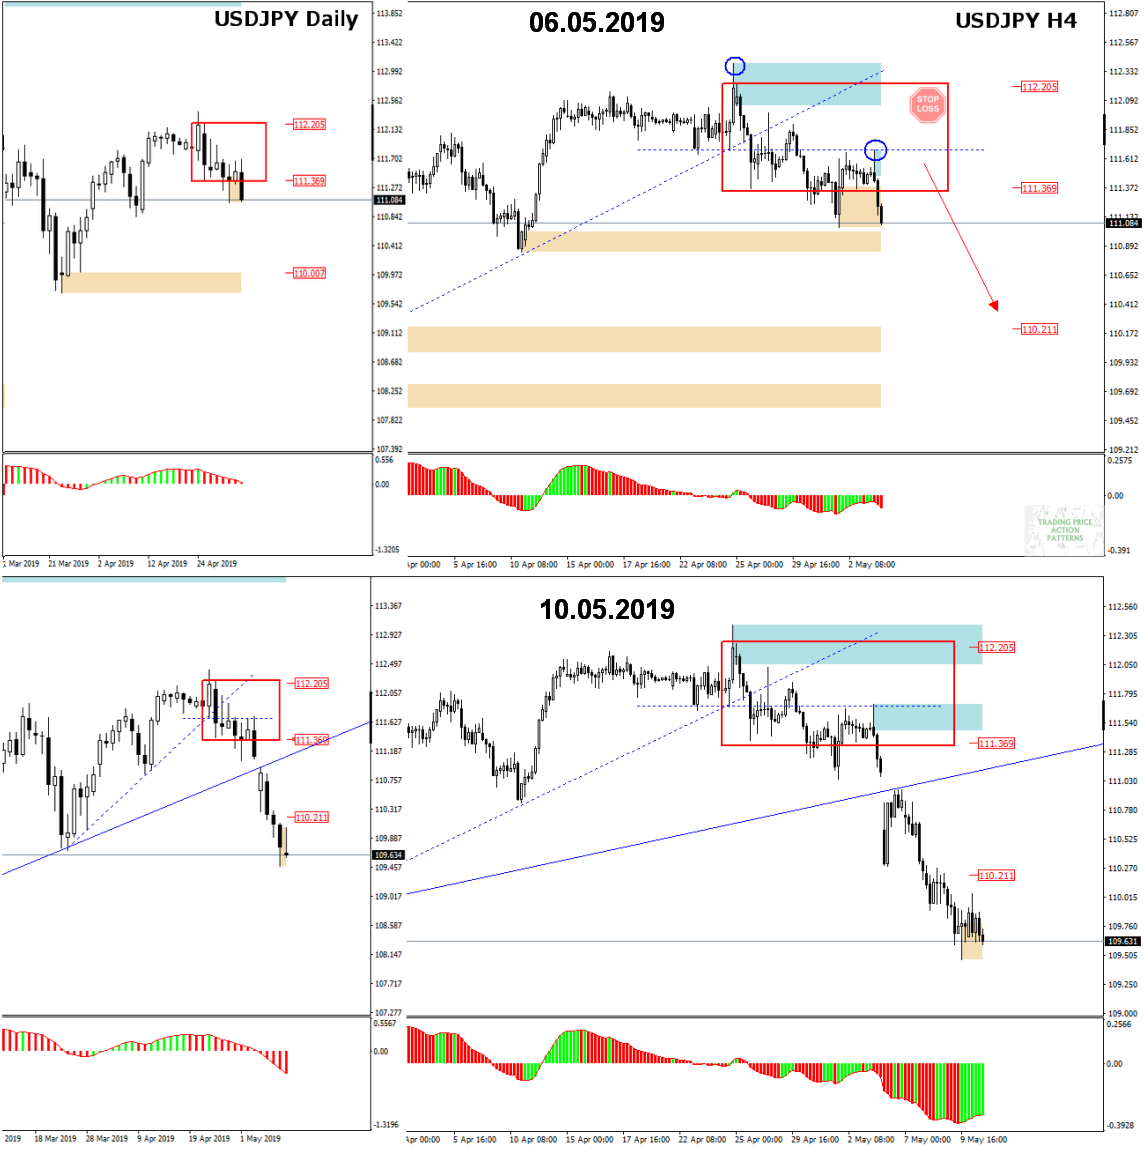
USDJPY ( chart above) very quickly realized the downward scenario, which can be seen in the first comparative chart. In this case, the (theoretical) basis for predicting declines was: “The H4 chart shows a downward pin bar negating 111.70 and the price, after a possible small upward correction (towards the IB lower limit), may start moving towards the nearest demand zone 110.20. Sell orders with a Stop Loss above 111.70 may be a good idea for the next sessions.” And so it went… The first session of this week opened with a drop gap, the drops took place without any major corrections.
USDCHF 06-11.05.2019
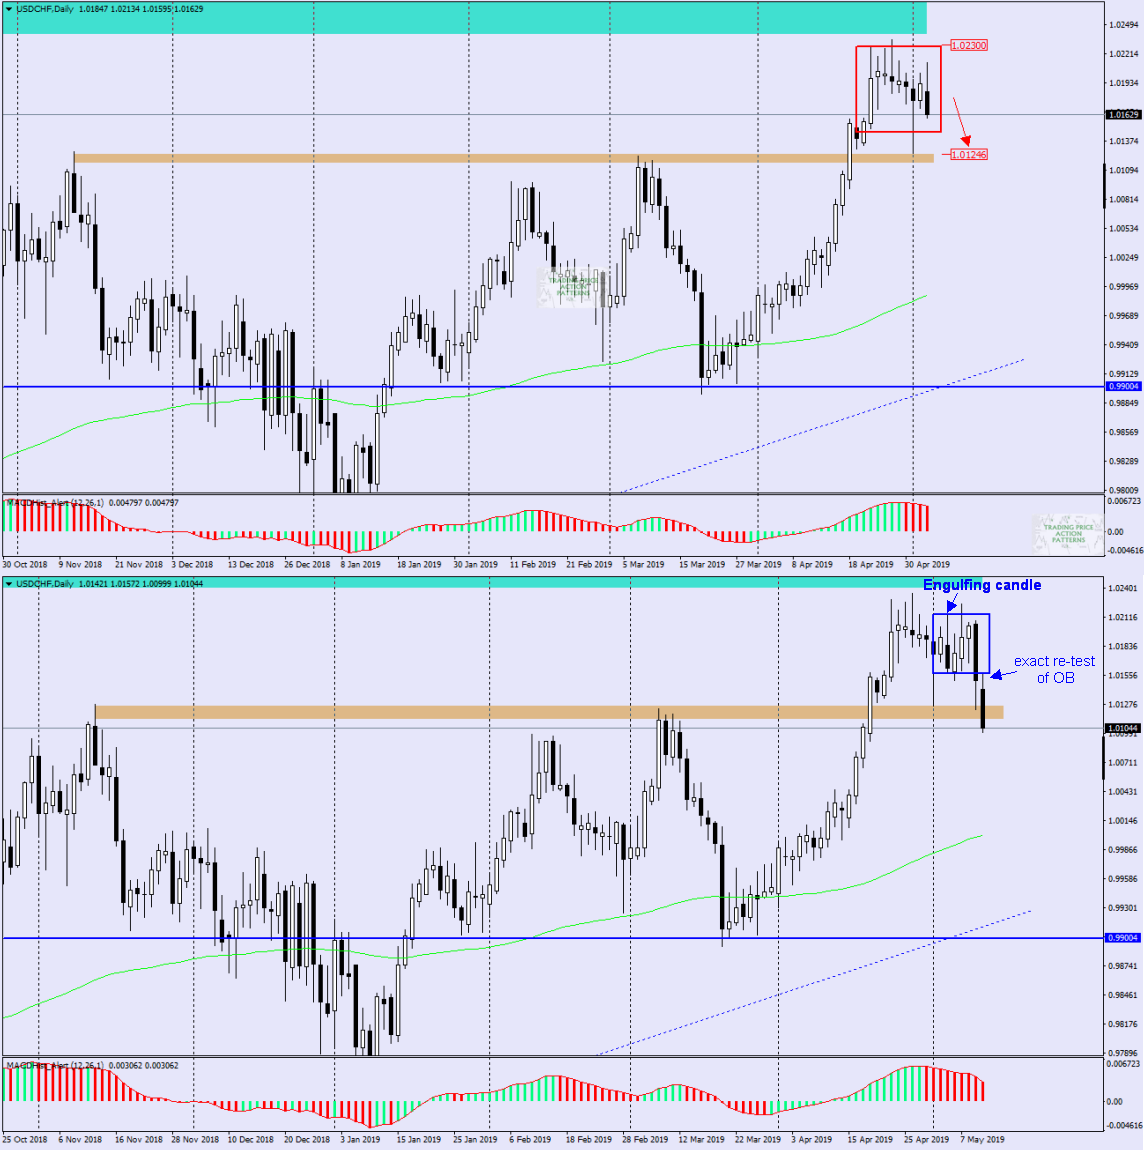
USDCHF – In this Monday’s analysis, I predicted drops based on the newly created Outside Bar, marked with a blue rectangle. I wrote this: “… Friday’s daily candle formed an outside bar ( bearish engulfing) and with the MACD oscillator decreasing, this is quite a strong signal to continue the declines. Again, the demand zone 1.01240 may become a place of the demand struggle with supply, which may result in another upward correction. However, if this level is overcome, the decreases may become more dynamic…“.
Here at first the quotations were not as unambiguous as in the case of the previous pair before the drops took place, the market tried to set a new maximum, putting my patience to the test. But everything ended well, the price after leaving the OB tested it from the bottom (this is the correction predicted in the analysis) and the price went down so it was really nice to look at it.
AUDUSD 09-10.05.2019
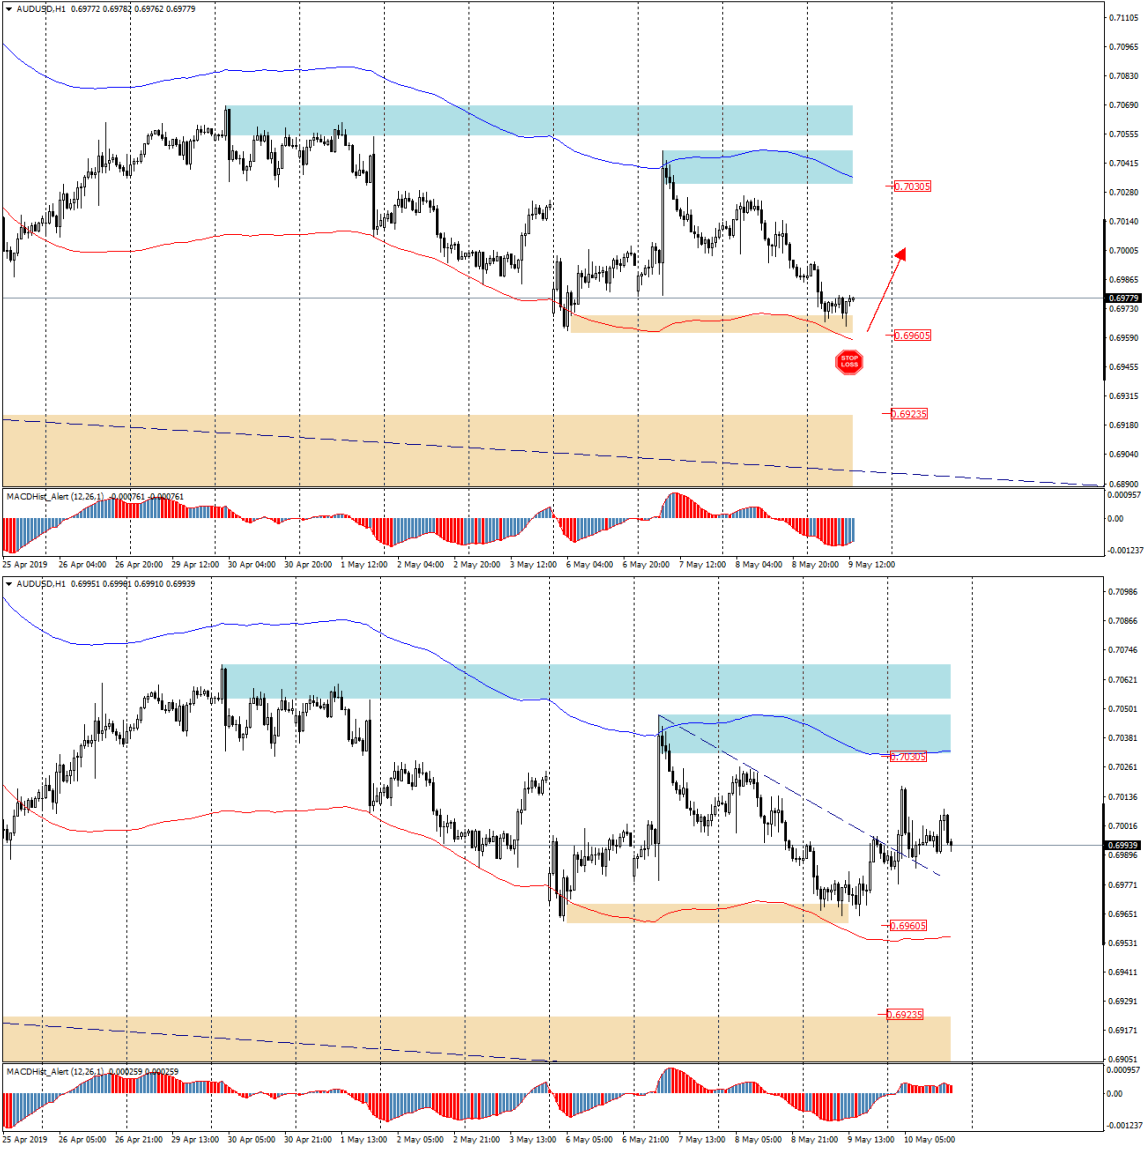
AUDUSD – another analysis from the passing week, very fresh, because it was written on Thursday afternoon. Here, analyzing the situation on the chart, I used the “envelopes” indicator – “AUDUSD – waiting for correction according to Envelopes”. How to use this indicator is described in several articles in the net so I will not write more about it here. Based on the graphs below from Thursday and today, we can conclude that this time too, the theory was confirmed by practice, and the price moved in the indicated direction, covering the distance of 40 pips.
As you can see from the examples above, there is no one universal strategy that can be used in day trading. It is worth to have a few of them and, depending on what the market dictates, choose the most suitable one for the current situation on the chart. This, of course, applies to those who prefer technical analysis…

 In our Facebook group, which you can join anytime: https://www.facebook.com/groups/328412937935363/ you will find 5 simple strategies on which my trading is based.


 Review")


