Last week I analysed the two currency pairs USDJPY and USDCHF with quite good results. Looking at the current situation on the charts, they seem to be still interesting, on both pairs with a high probability we can expect a continuation of declines.
USDJPY 06.05.2019
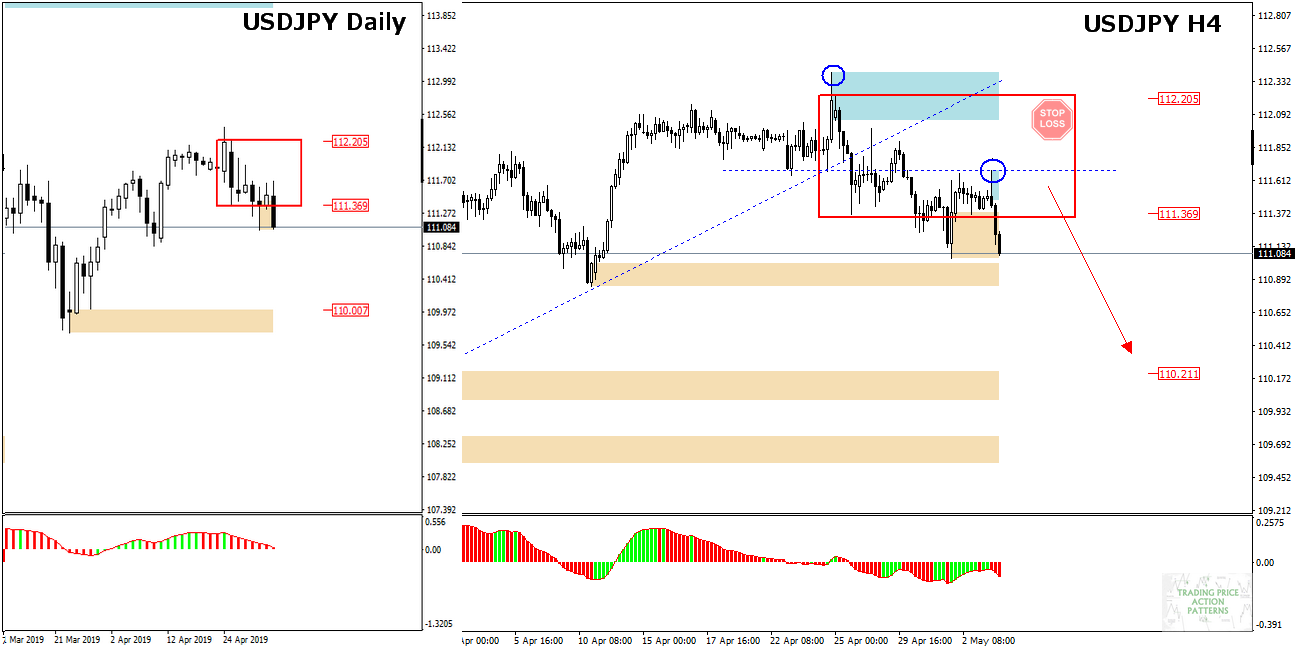
USDJPY – Daily chart (left) – the price has again left the Inside Bar pattern and the exit seems to have been successful this time.
The H4 chart shows a bearish pin bar negating 111.70 and the price, after a possible small upward correction (towards the lower IB limit), may start moving towards the nearest demand zone 110.20. Sell orders with Stop Loss above 111.70 may turn out to be a good idea for the upcoming sessions.
USDCHF 05.06.2019

USDCHF – Friday’s daily candle has created an outside bar – bearish engulfing and with the decreasing MACD oscillator it is a fairly strong signal to continue the decline. Again, the demand zone 1.01240 may become a place where supply and demand will be fighting, which may result in another upward correction. However, if this level is overcome, the decreases may become more dynamic.
Join us in our Trading Price Action Patterns group for serious traders, get fresh analyses and educational stuff here: https://www.facebook.com/groups/328412937935363/


 Review")


