Let’s make a summary of the passing week (23rd/2019) analyses. This week I was interested in two pairs – one currency (AUDUSD) and one commodity (SILVER). To analyze the charts I was attracted by the Price Action formations appearing there – “cup&handle” and Inside Bar. Below is a description of how these formations worked in a clash with the real market… so does the Technical Analysis still work?
AUDUSD 03-07.06.2019

On AUDUSD, commonly known as “kiwi” I observed a rather rare formation of “cup and handle”. This is a reversal pattern, and because it was formed on the support of the downward channel, I considered it to be “valid”.
In Monday’s AUDUSD analysis I wrote: -“…when you look at the H4 chart. Here appeared a formation of “cup” – quite little known and not very often appearing on the charts, although it can be extremely effective. Admittedly, an increase in the political and commercial tension between the USA and China may at any time destroy my forecasts and the coffee will be spilled… but despite the risk, I would bet on increases.”
Looking at the graph above, comparing the situation with Monday and the current one, we can unequivocally state that the “cup” proved to be a sign of a change in trend, because the price has risen by 100p since Monday, moving in the direction suggested by the pattern.
SILVER 06.06-07.06.2019
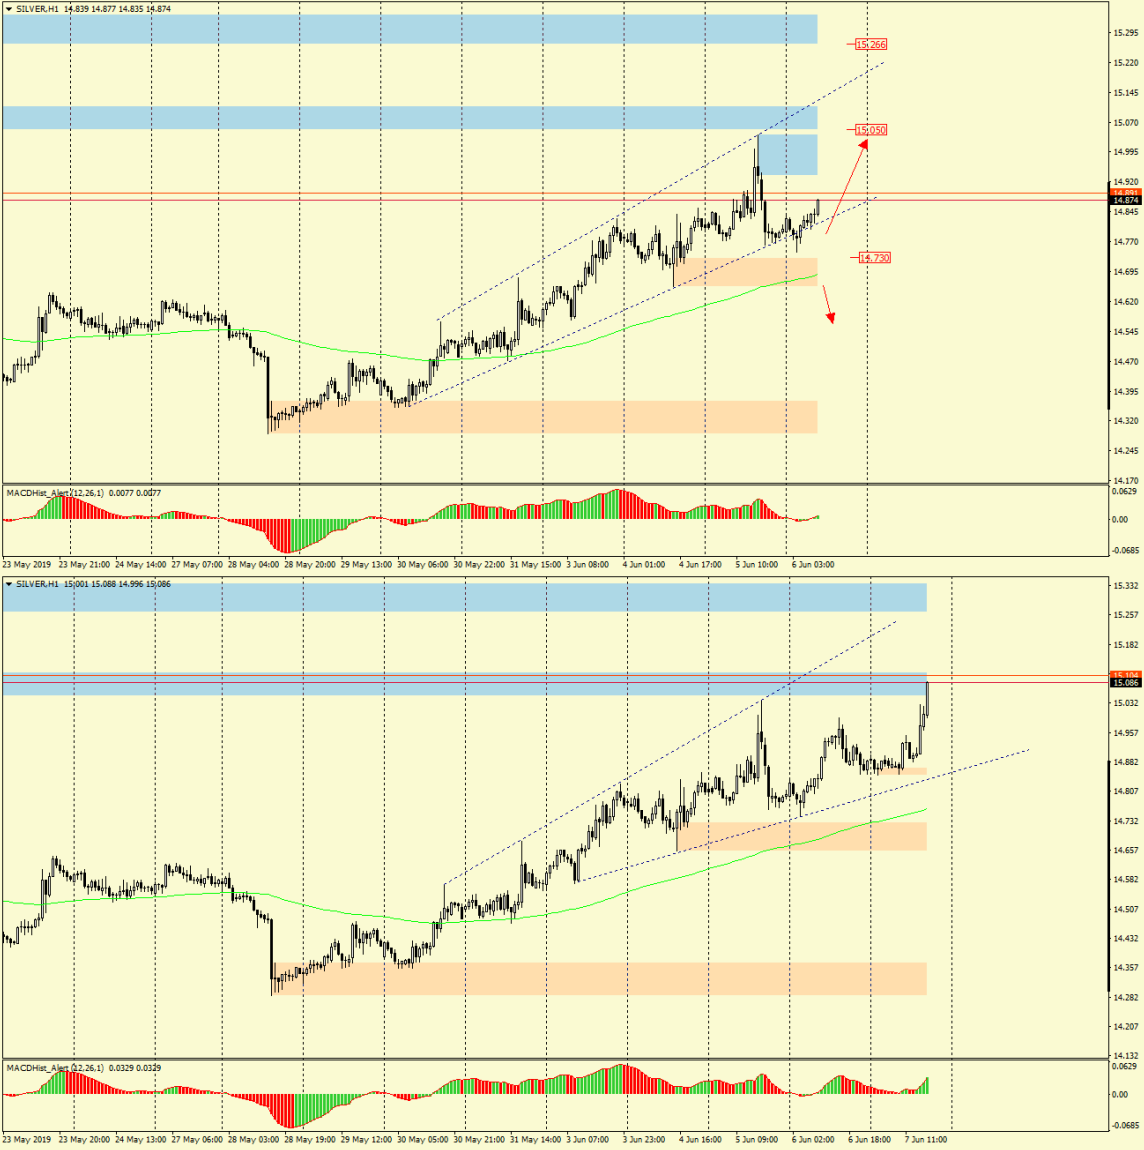
In the next analysis, which appeared on the portal yesterday, Thursday, I described the situation on the SILVER. I described it with these words:-” On Monday the price left Inside Bar high and everything points to further northward movement. Yesterday’s daily candle had the shape of a bearish pin bar, but since it is not at any important level, in my opinion, it is not a signal for declines. On chart H1 we can determine the likely demand and supply targets, i.e. the levels in which the silver price can move during the next sessions.
In the event that the demand reaches the advantage and the correction is continued, the price may reach the level of 15.05, where there is quite a strong resistance. However, if supply were to win, 14.70 may be the decisive factor in deciding whether the correction will end and the price will go south”.
Analyzing the current SILVER price chart, we can see that the price reached 15.00$/oz after which, after a short period of consolidation, it shoots upwards reaching the target of 15.05$/oz predicted in the analysis. Currently, it has reached this level and is moving further north. This was undoubtedly due to the weak labour market data in the USA, where payrolls were 100,000 new jobs lower than expected.
Despite accurate analysis, I didn’t catch too many pips… mainly due to the weather… it was impossible to sit indoor in front of a computer while so sunny and hot days ;). Since the tournament has ended ( organized by a group of traders on Facebook), interested parties can view my contest account, where most of the orders were based on the analysis made in April and May this year, and whose statistics can be found at this link: Trading Skill III.
 In our Facebook group, which you can join anytime: https://www.facebook.com/groups/328412937935363/ you will find 5 simple strategies on which my trading is based. There, every day we post fresh analyses of currency pairs and commodities


 Review")


