The weekend begins and traditionally it is time to sum up the analyses from the past week. This is the 34th such a weekend summary aimed at verifying the “theory”, i.e. the Technical Analysis of a given instrument with what the market has done, i.e. “practice”. Admittedly, this week three analyses appeared, but the last one only day ago so we will not deal with it, we will look at those that appeared on Monday and Wednesday.
SILVER 04-08.02.2019

Analyzing this precious metal on Sunday 03.02.19 evening, I predicted drops based on the resulting pinbar on the daily chart and engulfing bar in the H4 chart – : “When we look at the H4 chart we can see that the mentioned pinbar from the day chart is a pattern of bearish engulfing where the “mother candle” was formed on the resistance (upper edge) of the channel. This is an important piece of information because PA formations that are formed at important levels are more important than those formed in less significant places.
I am focusing on drops on this metal, where the closest target of supply can be level of demand zone at 15.65″
It turned out that I determined very precisely the direction and range of traffic where possible drops can reach, because the level of 15.65 indicated in the analysis was reached, which can be seen in the graphs attached above.
GBPJPY 06-09.02.2019
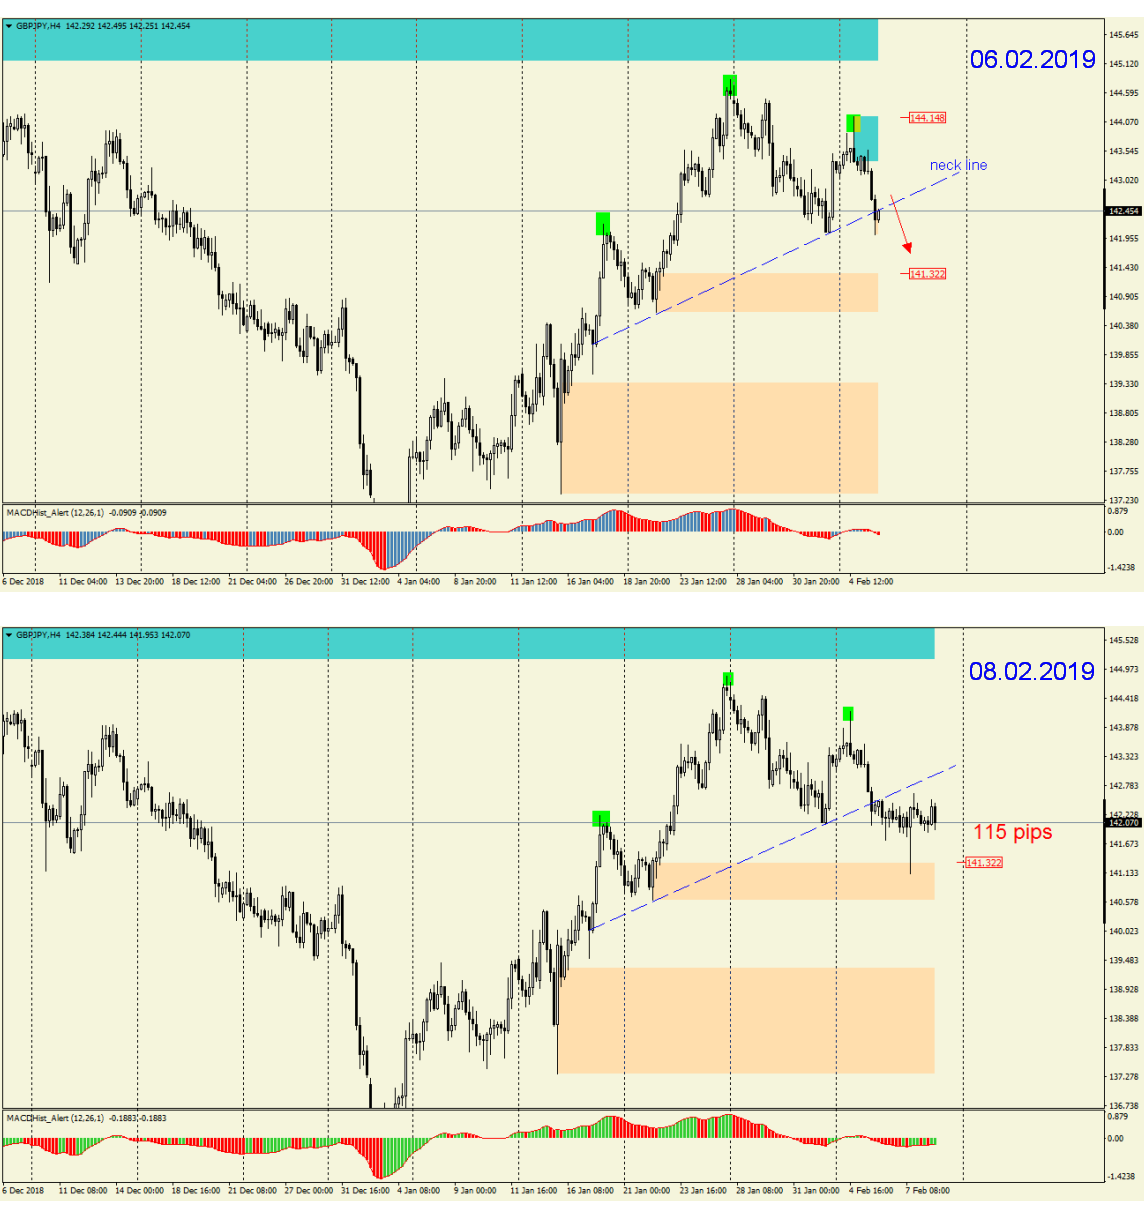
GBPJPY – let’s see how the analysis written on Wednesday worked: “GBPJPY – RGR on H4 – will it confirm the falls?” Looking at the chart above gives us an unambiguous answer.
The quotations of this pair went according to what I wrote then-:” Looking at chart D1 we can see that this week promises declines, as evidenced by Monday’s PinBar and today’s day candle, which created the maximum on MACD (oscillator started declining).In addition, the chart H4 can also see the Head and Shoulders formation, admittedly slightly slanted…. However, all levels seem to meet the conditions for this type of formation. The neckline has been defeated and the price is currently oscillating near it. The closest level of support is about 100p lower, i.e. 141.30-40. If the neckline retest turns out to be effective, you can think of a sell order”.
The range of traffic slightly exceeded the expected level of support and amounted to 115p. This week I can consider as a positive one, because not only the direction was well predicted, but also the expected range of price movement was correct.
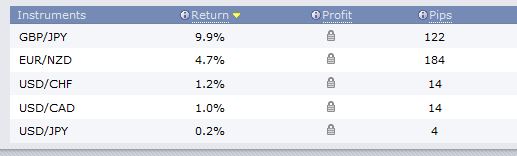
This week’s prey:


 Review")


