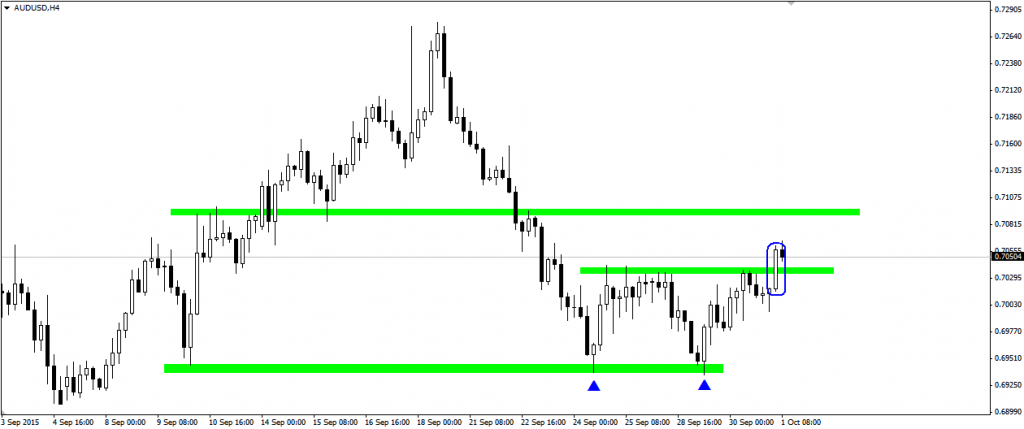
Prediction about gains and boom (I wrote about it on Tuesday) is starting to happen. Currently there is double bottom pattern on H4 chart. Very important is the way of activation – break resistance at 0.7040. This break happened with strong bullish candle which can lead price in the next few hours. The potential growth target is at least at 0.7095 resistance, however range of double bottom pattern points higher gains.
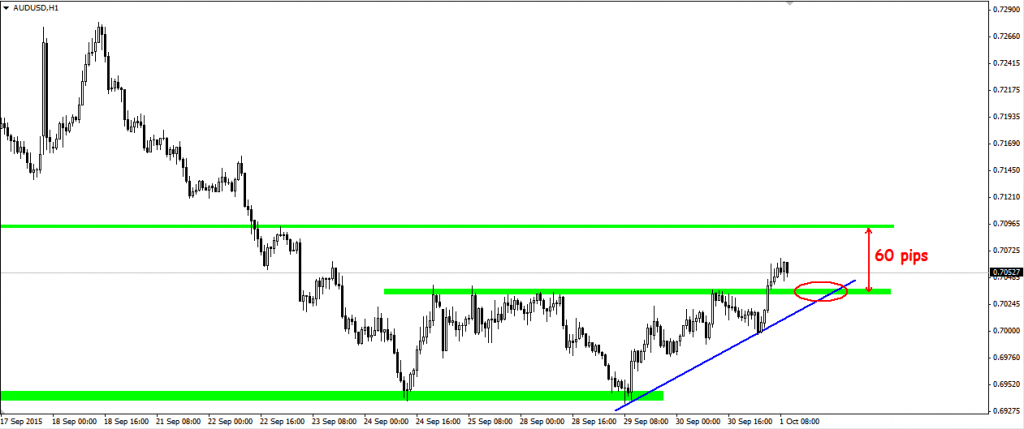
As you can see on H1 chart, you just have to wait for re-test of broken area which now turned to resistance. Range between support and nearest resistance is about 60 pips. It seems like you can try to use it if some interesting candle signal happen. You should look for it on smaller time frames, let’s say M30 or H1. You have to remember that longer trend is still clearly bearish and this position is quite risky, do not forget about setting SL.
 This analysis was created in cooperation with XM. Open account right now here.


