Binary Options Strategy
This strategy in binary options uses only one trend indicator; Bollinger Bands. In this version it is directed at traders who prefer mostly short-time options (M5 chart and options expiring in 5-15 minutes).
This system is very simple and it is based on breaking out above or below Bollinger bands. It generates a lot of signals and it will be optimal also for beginning traders. You should always check efficiency of the strategy before using real money. We recommend uTrader broker, with its risk-free demo account.
What are Bollinger Bands?
Bollinger Bands are a tool invented by John Bollinger in the beginning of the ‘80’s. They were created based on observation of price volatility. Bollinger noticed that price volatility is dynamic, not static. The goal of bands is to identify price highs and lows. According to his definition price reaches a top near the upper band and a bottom near the lower band.
Bollinger Bands consist of:
- middle band – N-period moving average;
- upper band – K times an N-period standard deviation above the moving average;
- lower band – K times an N-period standard deviation below the moving average;
- default N=20, K=2
Basics of Bollinger Bands M5
This strategy is based on a temporary selling or buying on the market. When the price is in temporary or full reversal, the Bollinger Bands M5 can assist in making decisions about an entry into the market and choose the right direction.
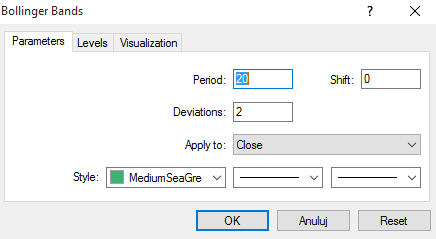
Indicator used: Bollinger Bands (MT4: Insert -> Indicators -> Trend -> Bollinger Bands) with default settings (period 20, shift 0, deviations 2).
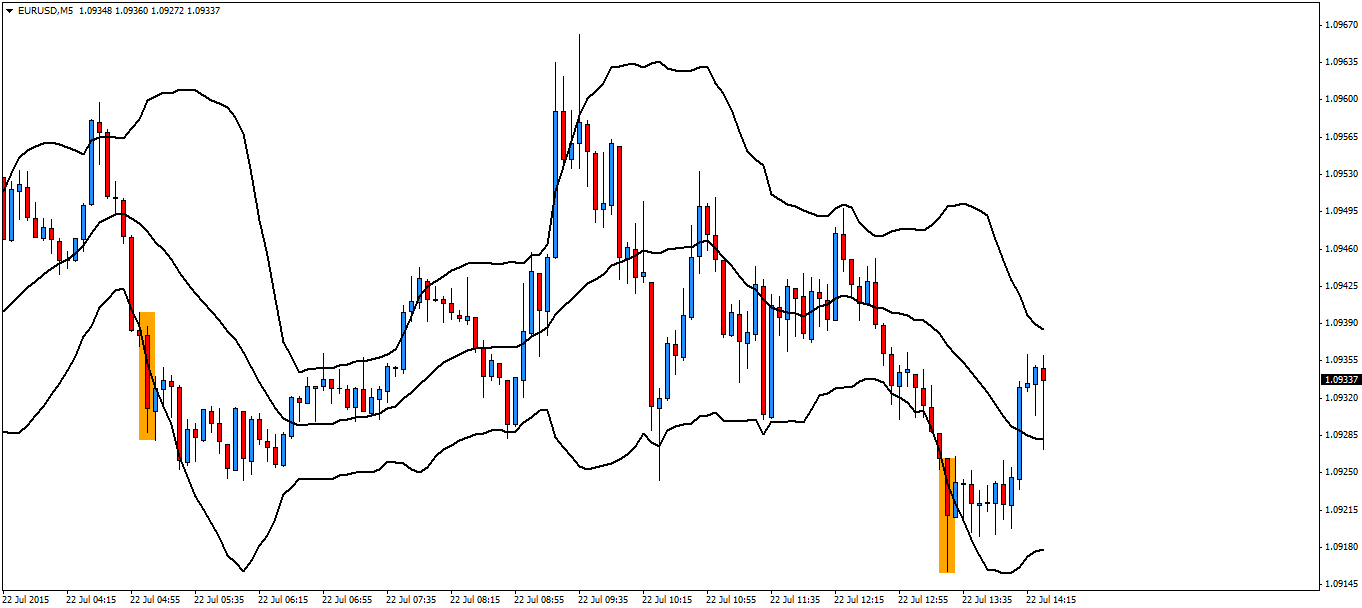
- CALL signal – break below lower band
- PUT signal – break above upper band
When to buy a CALL option
When the price breaks the lower band from above. The body of the candle need to break the bank not just the wick.
Right after close of signal candle you buy a CALL option (expiring in 5-15 minutes). Examples on EURUSD chart:
When do we buy a PUT?
When the price breaks the upper band from below. The break must be made by the body of the candle not just the wick.
Right after close of signal candle buy a PUT option (expiring in 5-15 minutes). Examples on EURUSD chart:

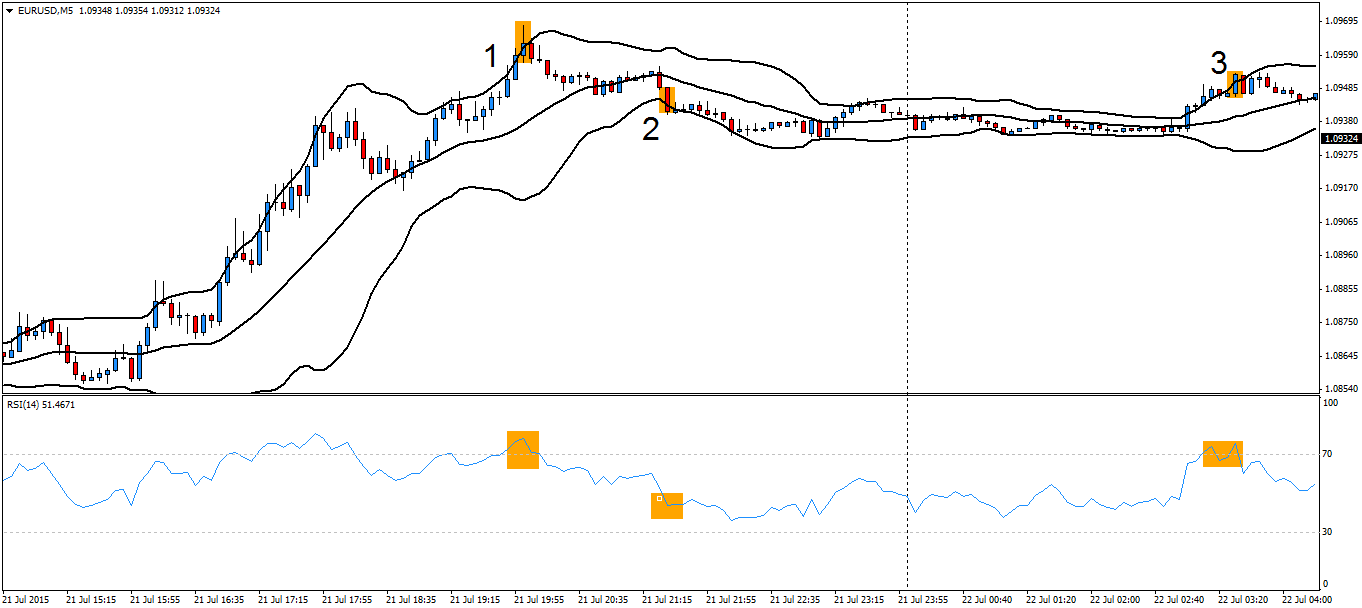
Additional filtering of signals with RSI indicator
To filter signals you can use an RSI indicator (period 14, levels 30-70) as an additional technical analysis. A PUT option is opened the moment RSI reaches or breaks above the buying level (70) and CALL option is opened when RSI reaches or breaks selling level (30).
On the chart we can see that in the second example signal the candle broke the lower band, without confirming the move on the RSI. A CALL would bring profit in this case, but filtering lets you improve efficiency of your trading strategy. You can check this strategy with uTrader – binary options broker with risk-free account.
WARNING! You have to remember, that in case of so simple strategy more filters means better results. Do not ignore main trend and popular patterns of price reversal or continuation of trend.


