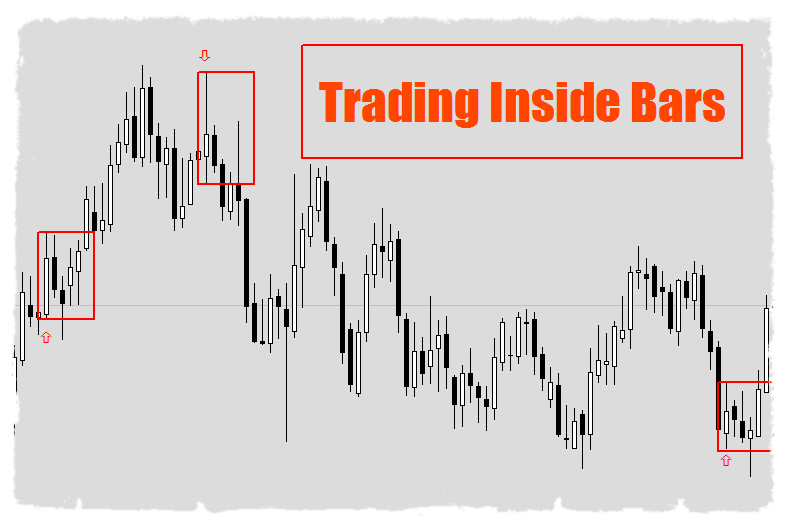
 Trading Inside Bars –under this heading you will find analysis made on basis of one of the most known Price Action formation – Inside Bar. Statistics show that best results gives breakout from Inside Bar formation on Daily chart, so mainly this time frame charts will be analysed.
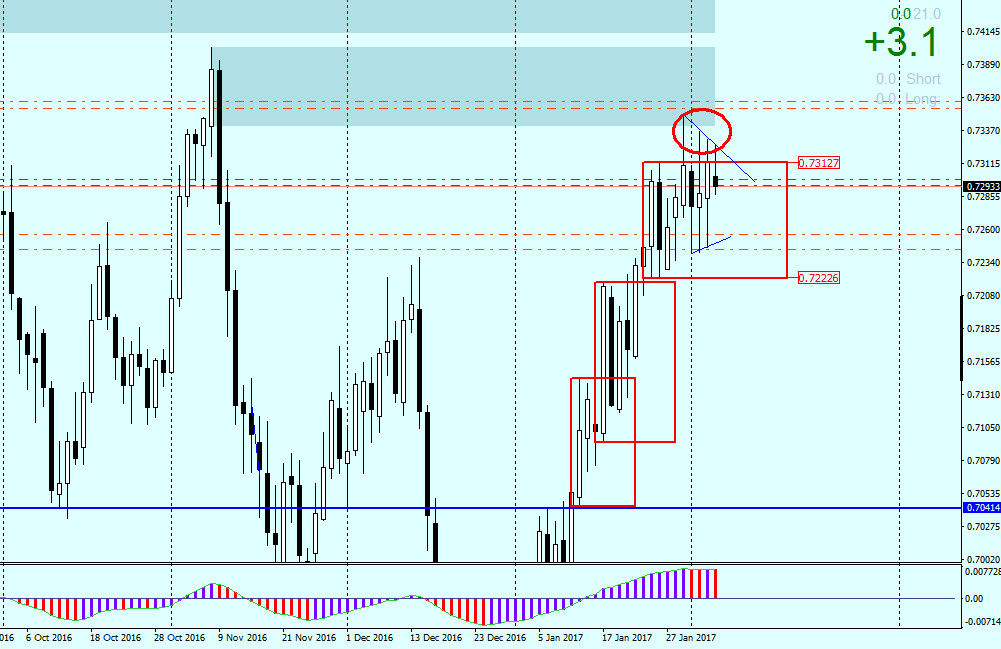
NZDUSD
On Daily chart of this pair we see interesting situation- during a strong bullish trend which started on 4Th January , we had three consecutive Inside Bar formations. The last one in which we are now was already broken out thru the top but both daily candles closed inside the IB drawing long upper shadows.
Now we can expect a correction of this bullish trend and after those two false breakouts, time for breaking the lower band of the IB. Before placing a trade for Sell it’s worth waiting for retest of the lower band in case such breakout will occur. We need to remember that tomorrow we have Payrolls and market can be unusually volatile…
Here you can check our last analysis which gave over 250 pips


 Review")


