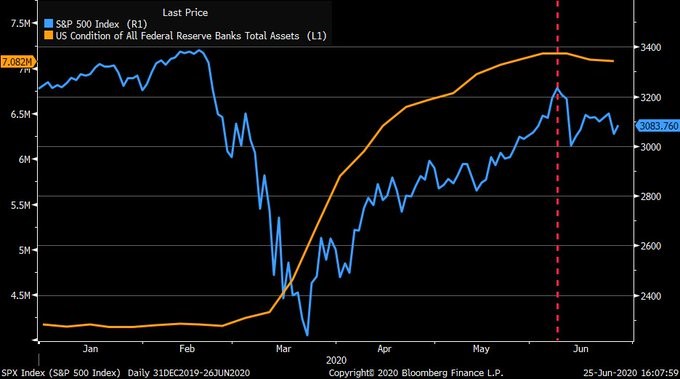
 Stimulus packages implemented in recent months to help the economy fight the effects of lockdown have largely moved to financial markets. On the one hand, purchased government and corporate bonds release their cash to their existing holders, and this, in the face of increasingly stronger currency devaluation by central banks, flows into other assets. It is not surprising, therefore, that with the current extremely high valuations of US stocks, only the Fed still holds these valuations. It just so happens that recently the dynamics of increasing the Fed’s balance sheet has started to decline, which effects can be seen immediately after the problems with continuing growth in the broad market.
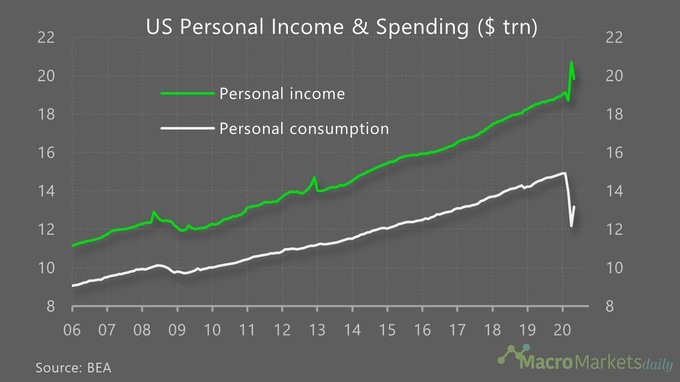
On the other hand, in the current election year in the US, lockdown was a great opportunity to further increase social welfare and make citizens dependent on the government by providing mass benefits to people who lost their jobs. Because they often exceeded their income from work (up to 30%), and at the same time the lack of necessity to provide it reduced household expenses, their disposable income increased significantly in their budgets.
These surpluses in the case of many younger people went to the stock exchange (also due to the closing of casinos), which greatly benefited from the March sell-off. However, market psychology suggests that this group of participants should still receive a lesson in humility. I would venture the thesis that rebound from recent months can only be a correction (wave B). As we know, the technology index already does not fit into this scheme due to new highs. Note, however, that the vast majority of markets have not reached the pre-pandemic peaks yet.
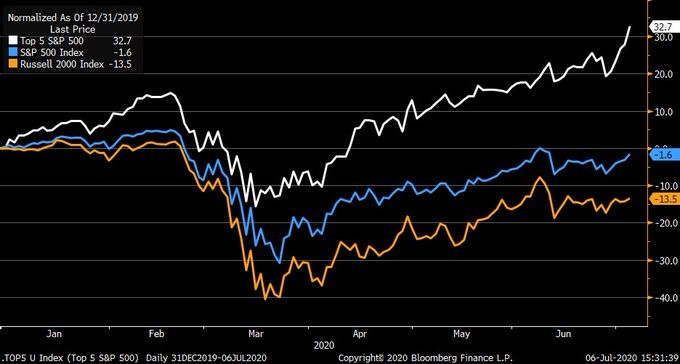
The concentration of buyers on technology companies means that the rebound of indices is becoming narrower, and thus the pulled market is becoming less and less number of companies. This is well illustrated in the chart above, which summarizes the rates of return for the five best companies from S & P500, the S & P500 index and the index of small companies, which has been losing 13% since the beginning of the year. This narrowing growth of the market is therefore another, after the millennials, striking warning signal.
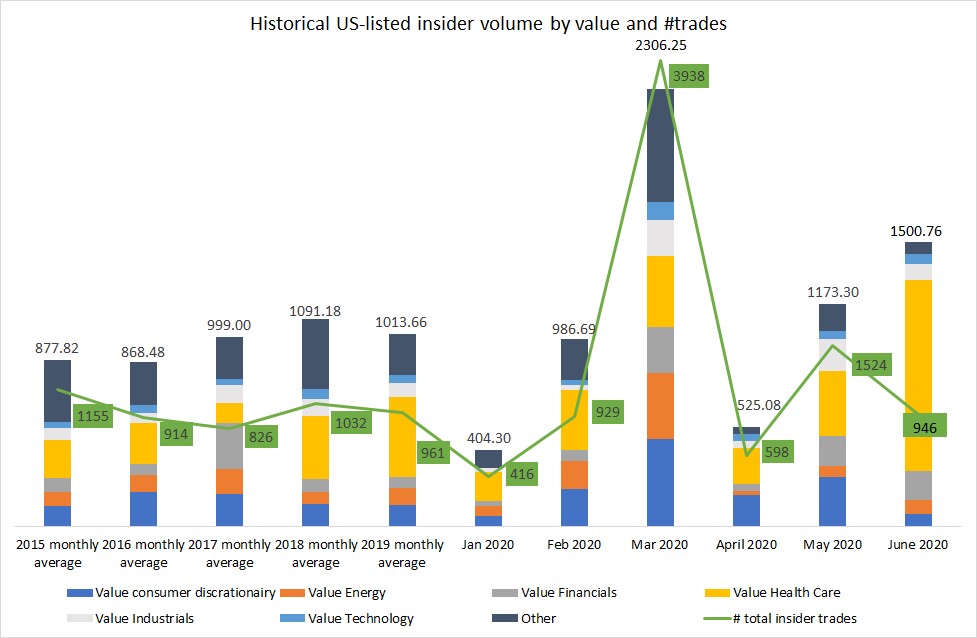
Insiders are not involved in the market
 Source: Seeking Alpha
In one analysis at Seeking Alpha, the behavior of market participants who have access to confidential information is looked at. It turns out that their activity dropped significantly in June. It was lower compared to the five-year average (946 buy transactions compared to the average of 1041) and much lower compared to May.

It is hardly surprising, however, since the global stock market gained 45% over a 2.5-month period. It is well represented by iShares MSCI ACWI ETF (All Country World Index), visible in the graph above. However, this does not stop buying on a massive scale investors who only during the lockdown period began their adventure with the market.

Source: @sentimentrader
Technical analysis also tells us that the scale and dynamics of this rebound may be a trap for many new investors. The analysis of emerging market behavior can lead to interesting conclusions, almost 40% of which have already gone beyond the upper Bollinger band, i.e. two standard deviations from the average. This is a very negative signal for bulls, especially if it appears on such a wide range of markets.
Small US companies are already in a bear market
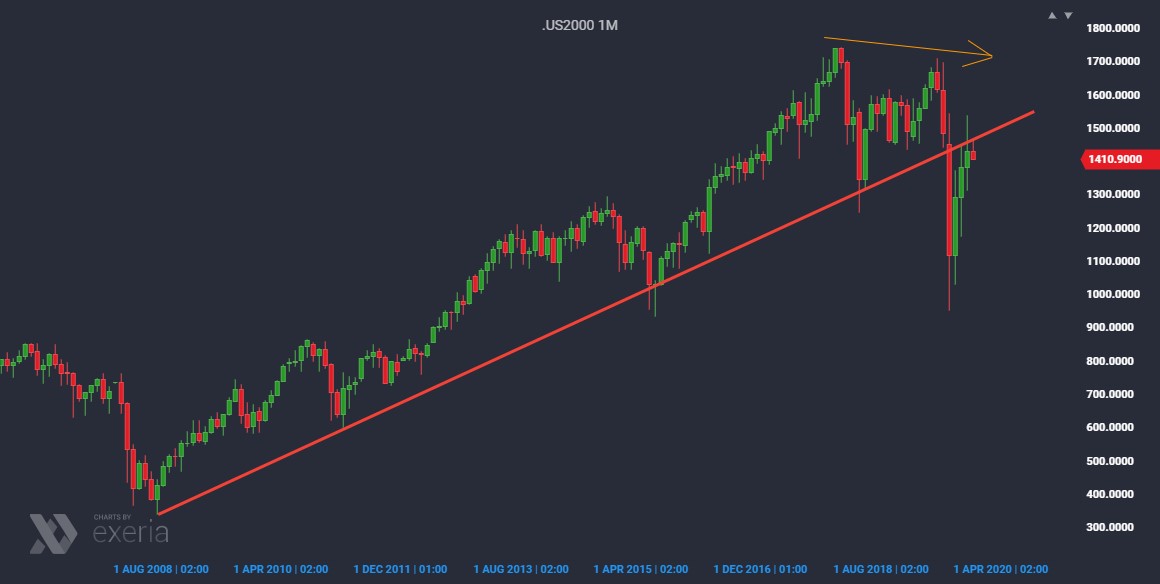
The state of the real economy is well illustrated by the situation of small companies, where the most jobs are created. They are represented in the US through the Russell 2000 index. It has been difficult to talk about the bull market for a long time. A rebound from low from the end of 2018 has no longer brought this index to new highs. In turn, the recent Covid panic broke through the upward trend line that the market has climbed through the entire bull market of the last decade. The current rebound is now testing this line from below, which many technical analysts can interpret as a pullback. Anyway, lower and lower highs and lows, which have been visible for two years, defining the downward trend, also suggest that trouble will continue soon.


 Review")


