The EURGBP pair quotations since January 2019 are moving in a not-so-frequently seen chart pattern formed by two diverging trend lines shaped like a megaphone, sometimes called a tube.

The 0.8860 symmetry axis is at the same time an important S/R level.
The previous week was a very steep downward trend and the weekly candle formed a pattern – bearish engulfing. In the W1 chart there is a downward divergence. Today’s quotations are already below the minimum of the mother candle – 0.8996.
You can see me trading live on Wednesday between 12 a.m. and 1 p.m. and here at 3-4 p.m.(London time).
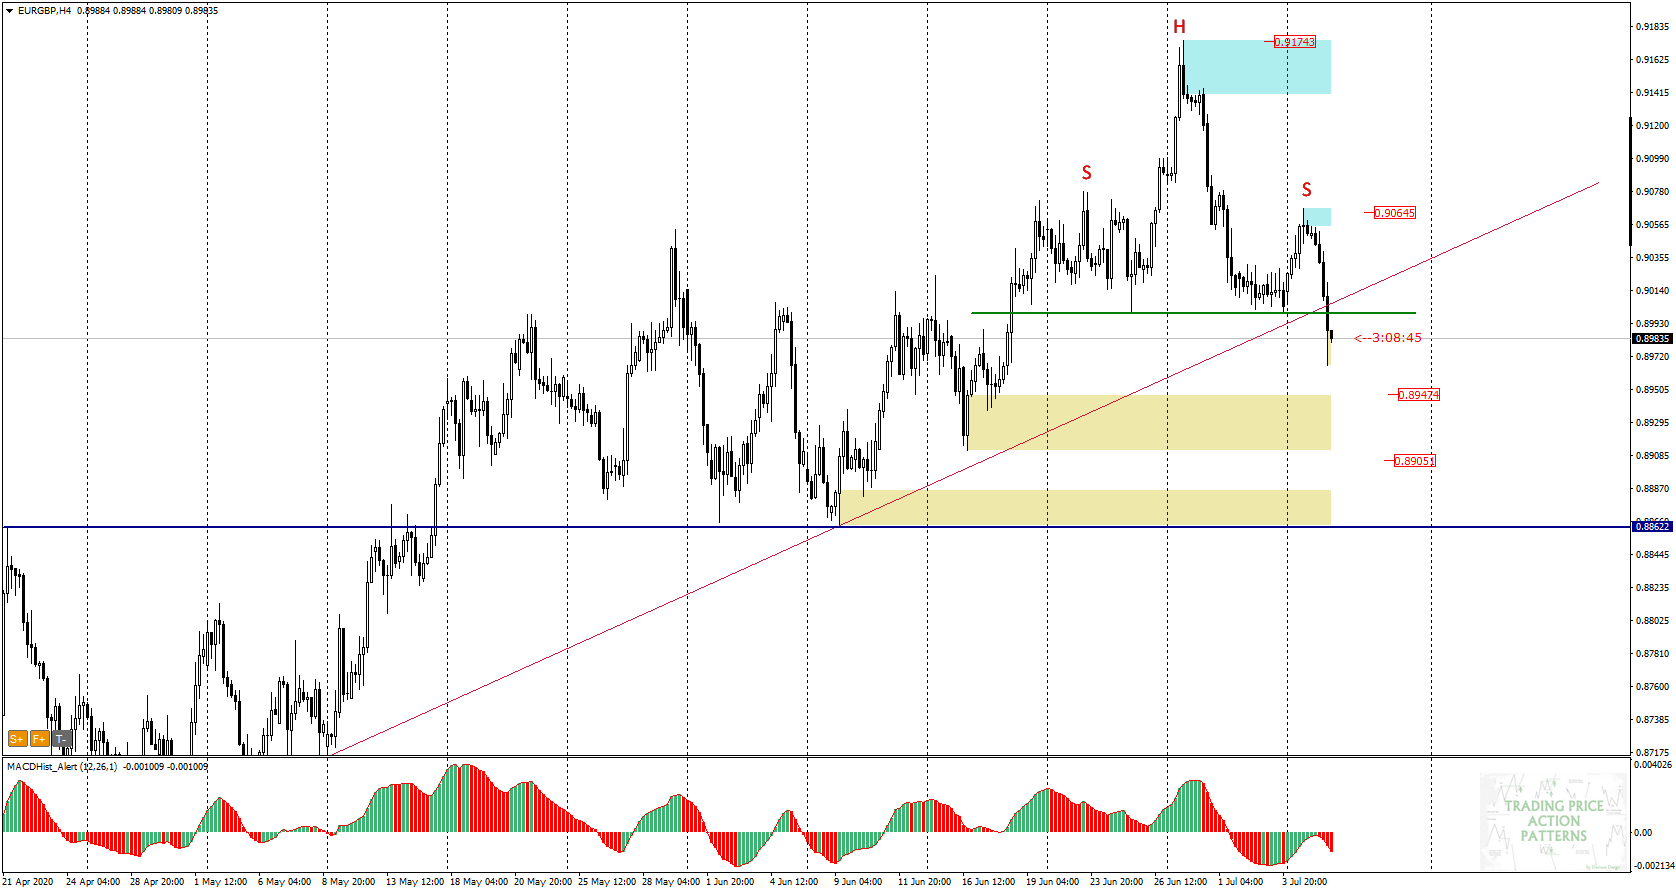
On the H4 chart we will notice a characteristic shape of the Head and Shoulders formation. The neck line (green) crosses the local trend line (red) creating a confluence point of support. Both have been overcome today suggesting an advantage of supply.
The closest target for sellers may be the 0.8950 demand zone, where an upward correction may occur to test the neck line from below, unless the market decides to do so first.
 In our Facebook group, which you can join anytime: https://www.facebook.com/groups/328412937935363/ you will find 5 simple strategies on which my trading is based. There, every day we post fresh analyses of currency pairs and commodities


 Review")


