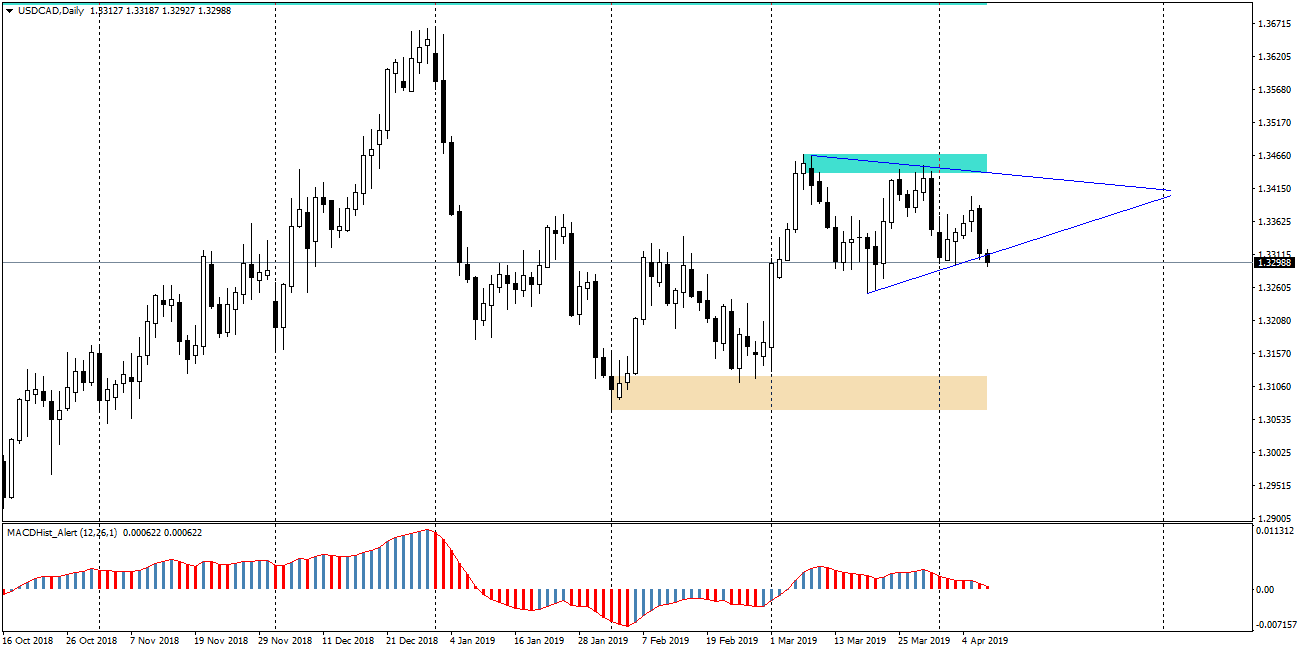
USDCAD quotations since the beginning of March have been moving in a consolidation with an ever smaller amplitude which turned to be a triangle pattern. Today the price has broken the support of this formation and at the time of writing the analysis was at 1.33, but to see if it is a permanent breakout, we have to wait until today’s daily candle is closed.
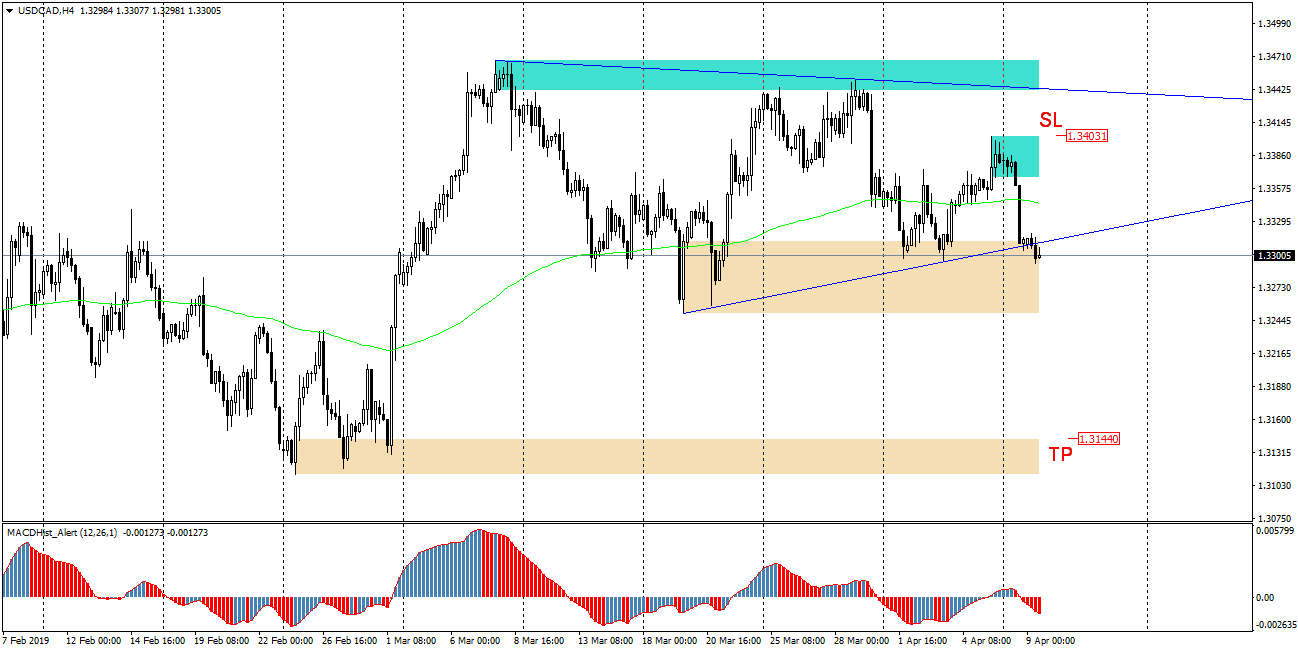
If we look at chart H4 when planning a sell order, the target for supply may be the nearest demand zone starting at 1.3150 and the level negating declines, i.e. where we place Stop Loss – around the last local maximum of 1.3400. At the current price of 1.33, the reward-risk ratio would be 1.5:1.
But as I already mentioned in the introduction, it is worth waiting until the daily candle is closed and if it is under the triangle support, then consider opening such an order, especially as USDCAD quotations are heavily influenced by the situation on the oil market, and just tonight we will learn about the data prepared by the American Petroleum Institute (API), which will publish its weekly report on oil supplies and reserves at 20:30 GMT.
Join us in our Price Action Patterns group for serious traders, get fresh analyses and educational stuff here: https://www.facebook.com/groups/328412937935363/


 Review")


