USDJPY has been moving in an upward trend since September last year.
After reaching the S/R 109.68 level, it turned several times to the south. It wasn’t until January 13th that the level was overcome and the pair set a maximum of 110.28 this year.
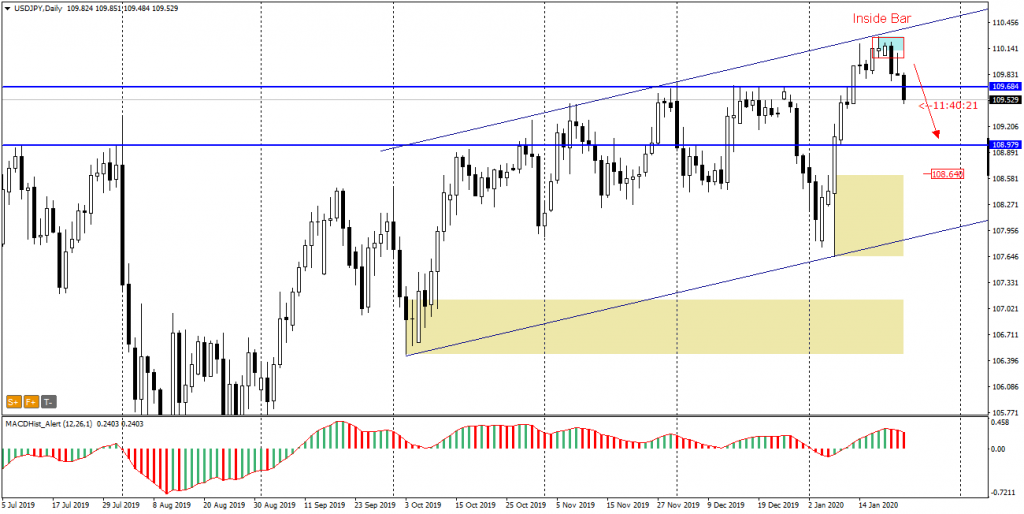
At the peak of the strong upward momentum that started on January 8th there is the Inside Bar formation, from which on Tuesday there was a downward breakout. Overcoming the lower limit of IB was accompanied by the appearance of a “red” MACD which signals the entry of the pair into the downward phase.
From Monday to Friday – Live trading at 13:00 (London time) chat, analyse and trade with me: https://www.xm.com/live-player/basic
Today the price has overcome the aforementioned S/R 109.68. Patience is advised before we decide to open a sell order. Confirmation that the downward trend is in the game will be that today’s daily candle will close below this level, and we can expect the downward trend to continue. A possible return of the price above 109.68 may negate the setup. A round level of 109.00 may be a likely target for supply.
In our Facebook group, which you can join anytime: https://www.facebook.com/groups/328412937935363/ you will find 5 simple strategies on which my trading is based. There, every day we post fresh analyses of currency pairs and commodities


 Review")


