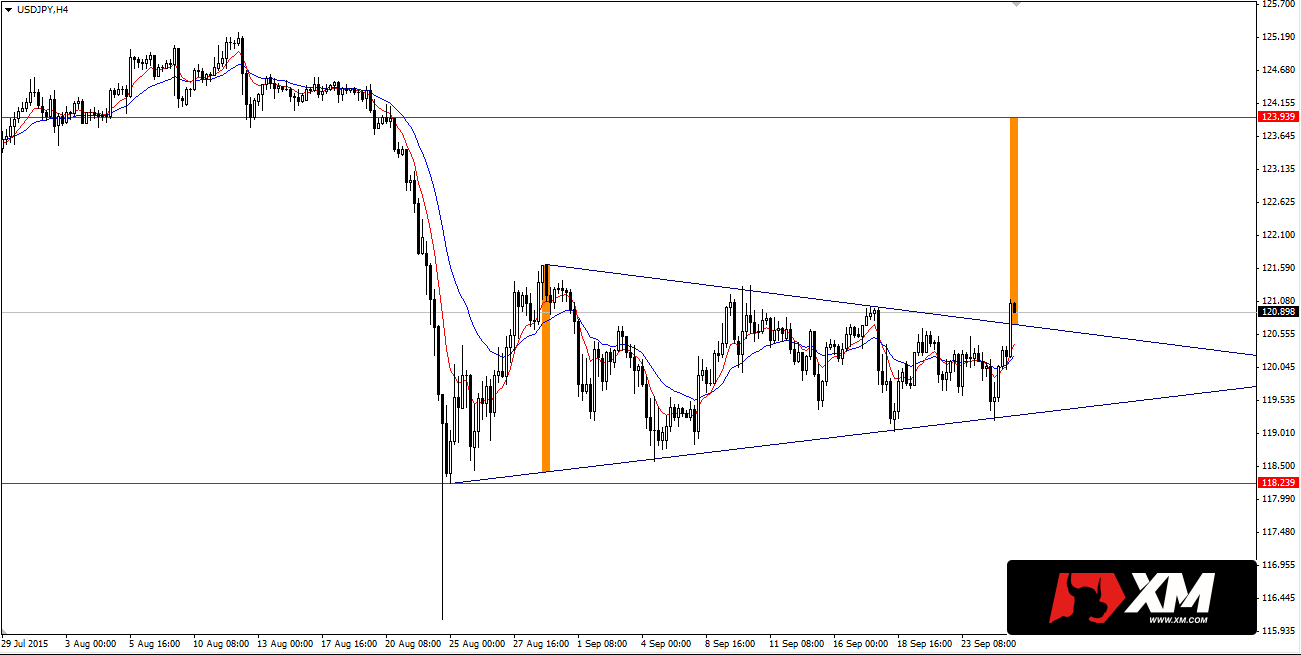
On the USDJPY chart for almost a month there is a consolidation, which took form of triangle. This pattern can predict both continuation of trend or its reversal.
In this case currently price breached above this formation on H4 chart. Classic technical analysis assumes that range of this move will set height of the triangle. On USDJPY it is more than 320 pips.
Aggressive traders can open position just after bounce, but conservative investors should wait for re-test and signal for confirmation.
Before taking decision it is worth to look to macroeconomics calendar. If you take a look at US dollar, there can be bigger volatility on the markets after GDP Annualized being announced. This will give a chance of another scenario where we wait for confirmation of breaching out of triangle on daily chart. It is safer alternative than H4 chart, especially when you wait for readings.
Triangle mentioned before is seen on the daily chart, but it is better seen on H4 chart below.
![]()
![]() This analysis was created in cooperation with XM. Open account right now here.
This analysis was created in cooperation with XM. Open account right now here.


 Review")


