GBPUSD
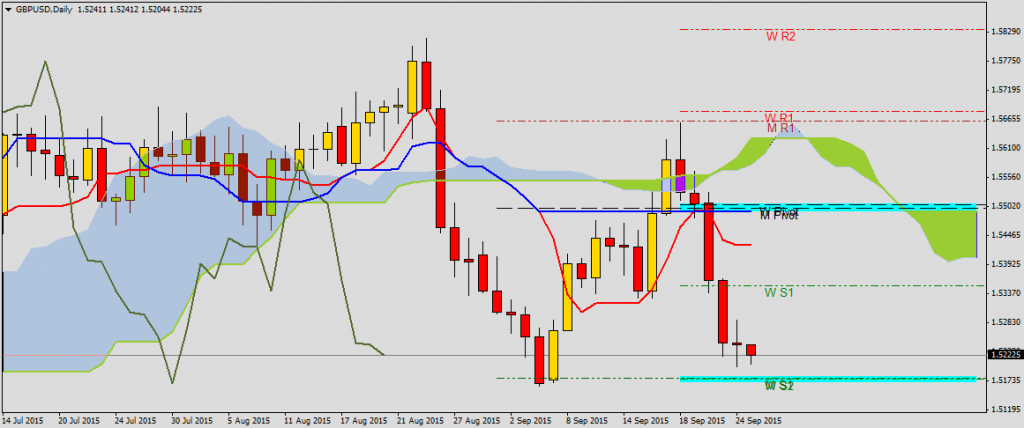
On Monday GBPUSD started from testing Teknan-sen, Kijun-sen and weekly and monthly pivot 1.5504-1.5490. Breaching such strong area ended with generating sell signal. Price breached weekly S1 1.5352 and is getting closer to 1.5776 where weekly S2 and monthly S1 is located. This level covers bottom from August 4th.
USDCHF

USDCHF started week with declines to support area 0.9557-0.9526, where weekly S1, Kijun-sen and Kumo bottom are located. Then we saw big rebound above Tenkan-sen, weekly and monthly pivot, which is support for this pair and it was tested yesterday (0.9665). Price for another time is tryicg to breach weekly S1 0.9773 and there is not enough time for USDCHF to reach today weekly R2 0.9895. This setup of Ichimoku averages informs us about dominating bullish trend on this pair.
USDJPY

USDJPY stays in side trend after testing weekly S1 119.03. Price stays between Tenkan-sen and weekly pivot 120.02 and monthly pivot 120.88. It looks like upper band of this consolidation will be tested today.
AUDUSD

AUDUSD realized 100% of this week plan. Although there is still sell signal from crossing Tenkan-sen and Kijun-sen price reached yesterday to weekly S2 and monthly S1 0.6955 and probably will return to horizontal Tenkan-sen 0.7109.
GBPJPY

Similar situation is on GBPJPY. O Tuesday there was sell signal generated by drop of price below Tenkan-sen and weekly pivot 186.25 and yesterday we met Target Point, which was located at weekly S2 182.16. Today so far we have correction, which can end by testing S1 184.20 or even Tenkan-sen 184.95.


 Review")


