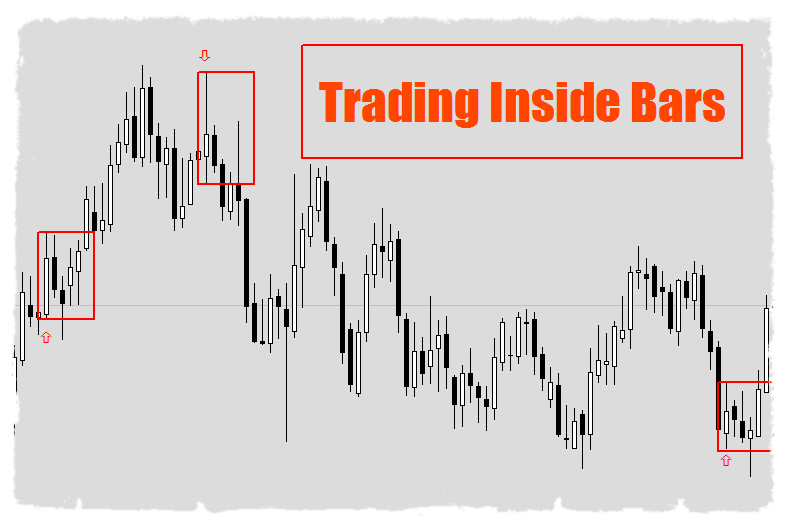
 Trading Inside Bars –here you will find analysis based on one of the most known Price Action formation – Inside Bar. Statistics show that best results gives breakout from Inside Bar formation on Daily chart, so mainly this time frame charts will be analysed.
Last week on the USDJPY daily chart was formed an Inside Bar by the day candle from 15.11 with range from 113.50 to 112.50. On Friday price broke out from IB thru the lower limit. The breakout is so dynamic that there is a high probability of further declines, but before they can come we can expect a return to IB and a retest of recently broken level 112.50. The nearest level of support that can be encountered is 111.60, and its possible defeat may lead to the next support area 110.60. In case if the price returns to the interior of IB – the important level to keep eye on will be 113.15, whose overcoming may negate the bearish scenario.


 Review")


