The USDJPY pair has been moving in a downward trend for 5 weeks, the quotes have taken the shape of a descending wedge. Usually this formation is a form of accumulation, during which the quotations fall with a decreasing volume.
An upward wedge usually announces increases. The MACD on the daily chart has entered the ascending phase.
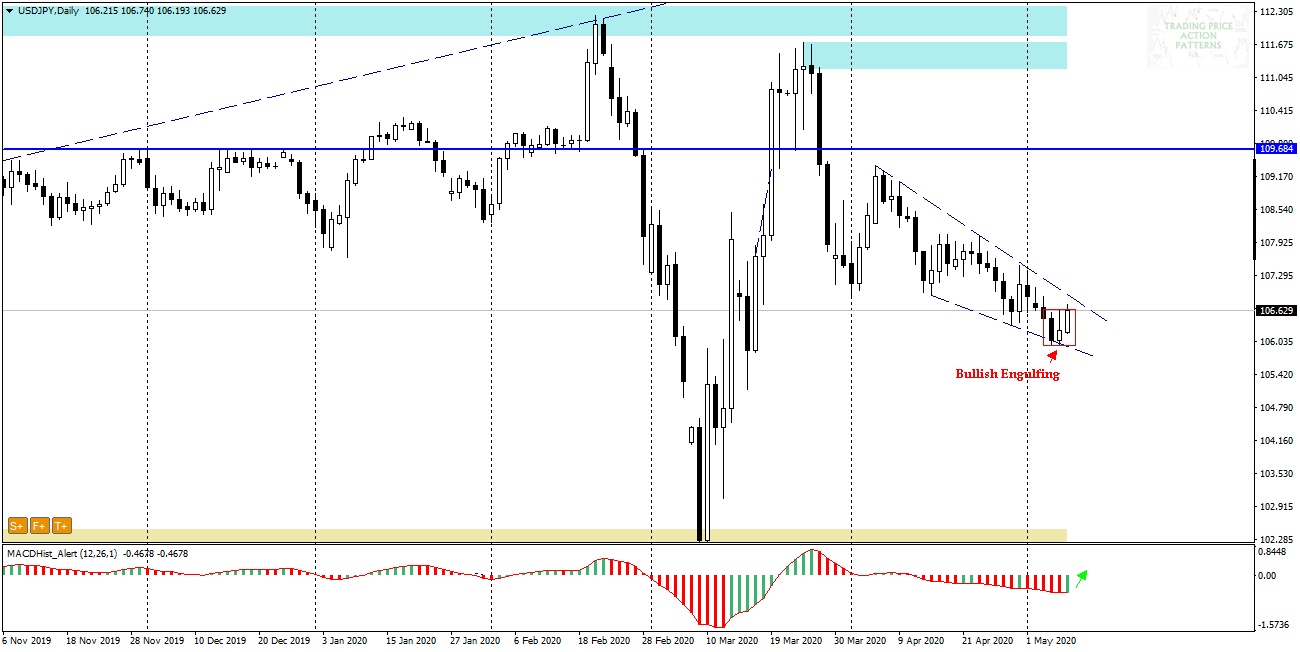
The daily candle from Thursday engulfed Wednesday’s range, creating a bullish outside bar – engulfing formation.
The range of formation is 105.95- 106.65. Overcoming one of these levels and breaking out of formation can initiate more dynamic price movements.
You can see me trading live every day from Monday to Friday between 1 p.m. and 2 p.m. (London time). During the live sessions I make analysis and show how I trade according to my strategies, I will also answer to your questions in the chat room. All you need to watch my live sesions is enter here: https://www.xm.com/live-player/intermediate
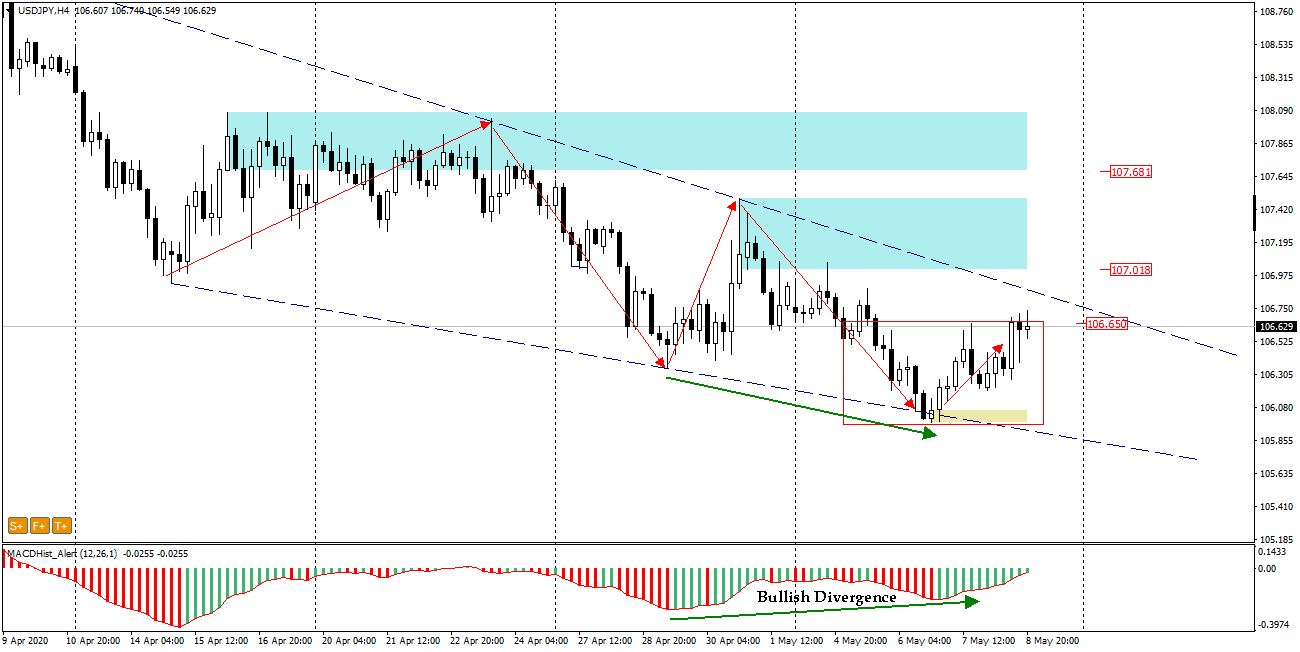
In the H4 chart, there is an upward divergence, which may suggest that the breakout will take place in the northern direction. If the wedge resistance is overcome, the increases may intensify.
If there is a break down from the engulfing pattern, it would be equivalent to overcoming the wedge’s support, which could be a strong downward signal. The decision belongs to the market, only then we can join by placing an order in the direction of the breakout from the formation.
In our Facebook group, which you can join anytime: https://www.facebook.com/groups/328412937935363/ you will find 5 simple strategies on which my trading is based. There, every day we post fresh analyses of currency pairs and commodities


 Review")


