On the first of April this year, a “death cross” appeared on the daily chart. I wrote about this phenomenon in my analysis on April 8th. This is when the two averages intersect, i.e., when the SMA50 average crosses the SMA200 average from above. The opposite situation is called the “golden cross”.
I don’t know who invented these names and described them for the first time, but they certainly make a big impression on traders and arouse increased interest on the instrument. In the case of the death cross, they herald the inevitable falls…

If you look at the GBPUSD daily chart it is easy to see that the previous one has brought more than 700 p’s declines. Admittedly, it took almost 3 months, but for long term players it was quite a nice reward.
You can see me trading live every day from Monday to Friday between 1 p.m. and 2 p.m. (London time). During the live sessions I make analysis and show how I trade according to my strategies, I will also answer to your questions in the chat room. All you need to watch my live sessions is enter here: https://www.xm.com/live-player/intermediate
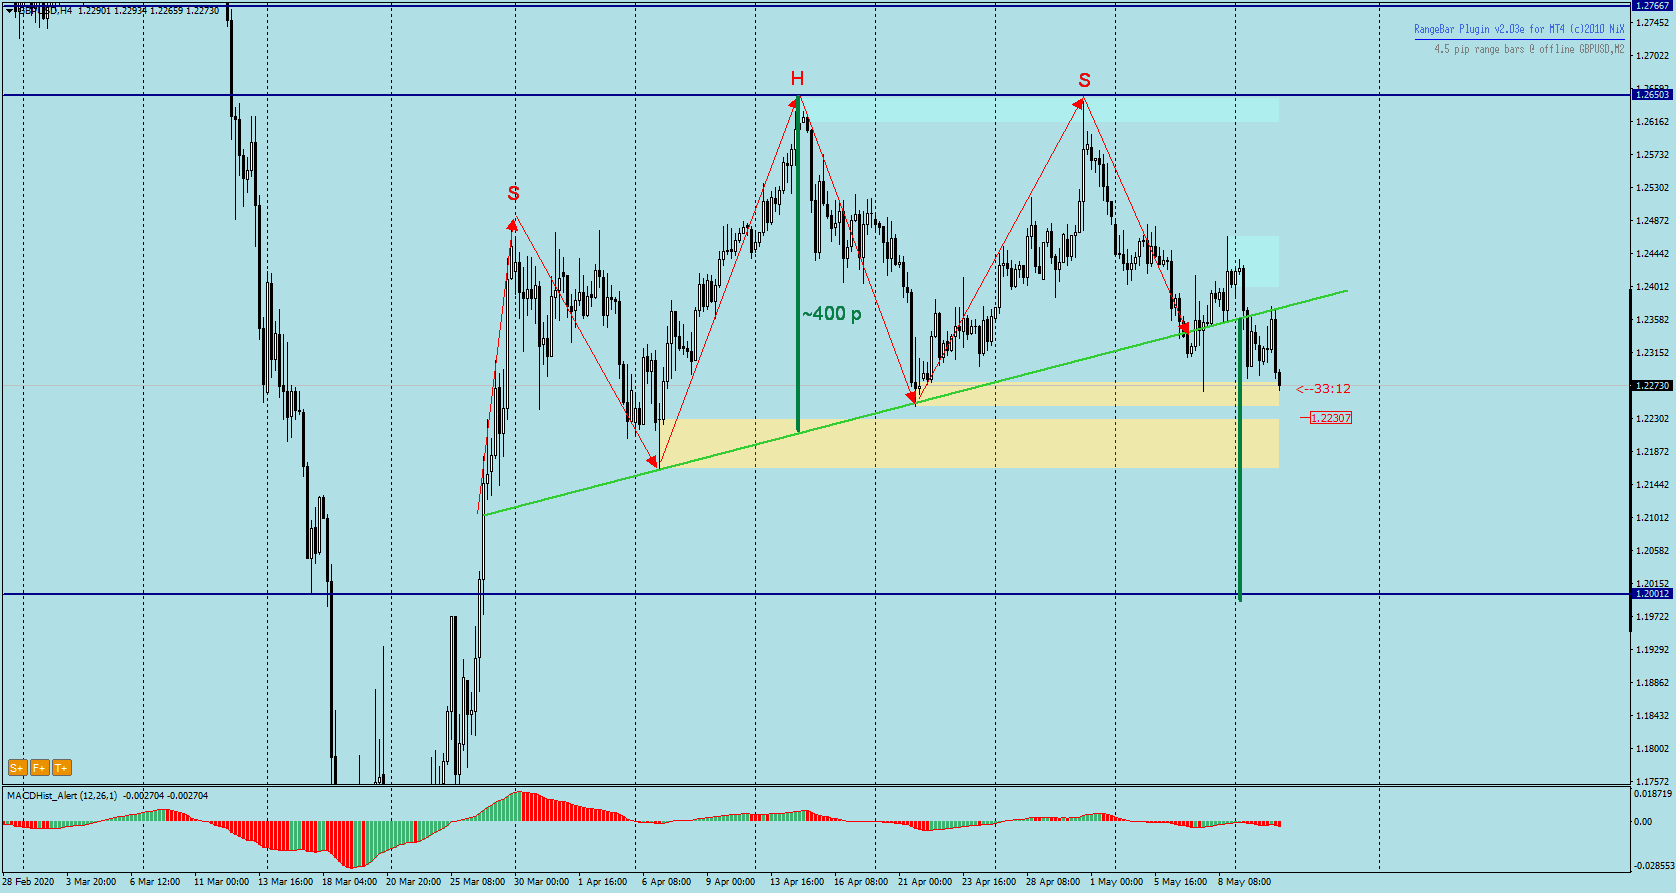
When we look at the H4 chart – we notice a familiar shape – the Head and Shoulders formation, the neck line seems to have been defeated, and today we witnessed its retest.
Everything indicates that the declines will continue. The nearest demand zone of 1.2230 may resist sellers by triggering an upward correction, but after it has been overcome the declines may even reach 1.2000, which would correspond approximately to the height of the mentioned H&S formation.
In our Facebook group, which you can join anytime: https://www.facebook.com/groups/328412937935363/ you will find 5 simple strategies on which my trading is based. There, every day we post fresh analyses of currency pairs and commodities


 Review")


