Since the end of March the USDJPY pair has been moving in a downward trend, but not a strong one.
After several days of declines there are quite strong upward corrections. Joining with a line the maxima and minima of the last four months we can see that the price is moving in a downward wedge formation.

In the past week, a formation of the bullish outsidebar appeared on the daily chart. On Friday, there was an unsuccessful attempt to break the top, but at the end the price is still inside the formation. The MACD oscillator has entered an upward phase which may suggest that demand is taking the lead.
ongoing analysis https://t.me/TradewithDargo
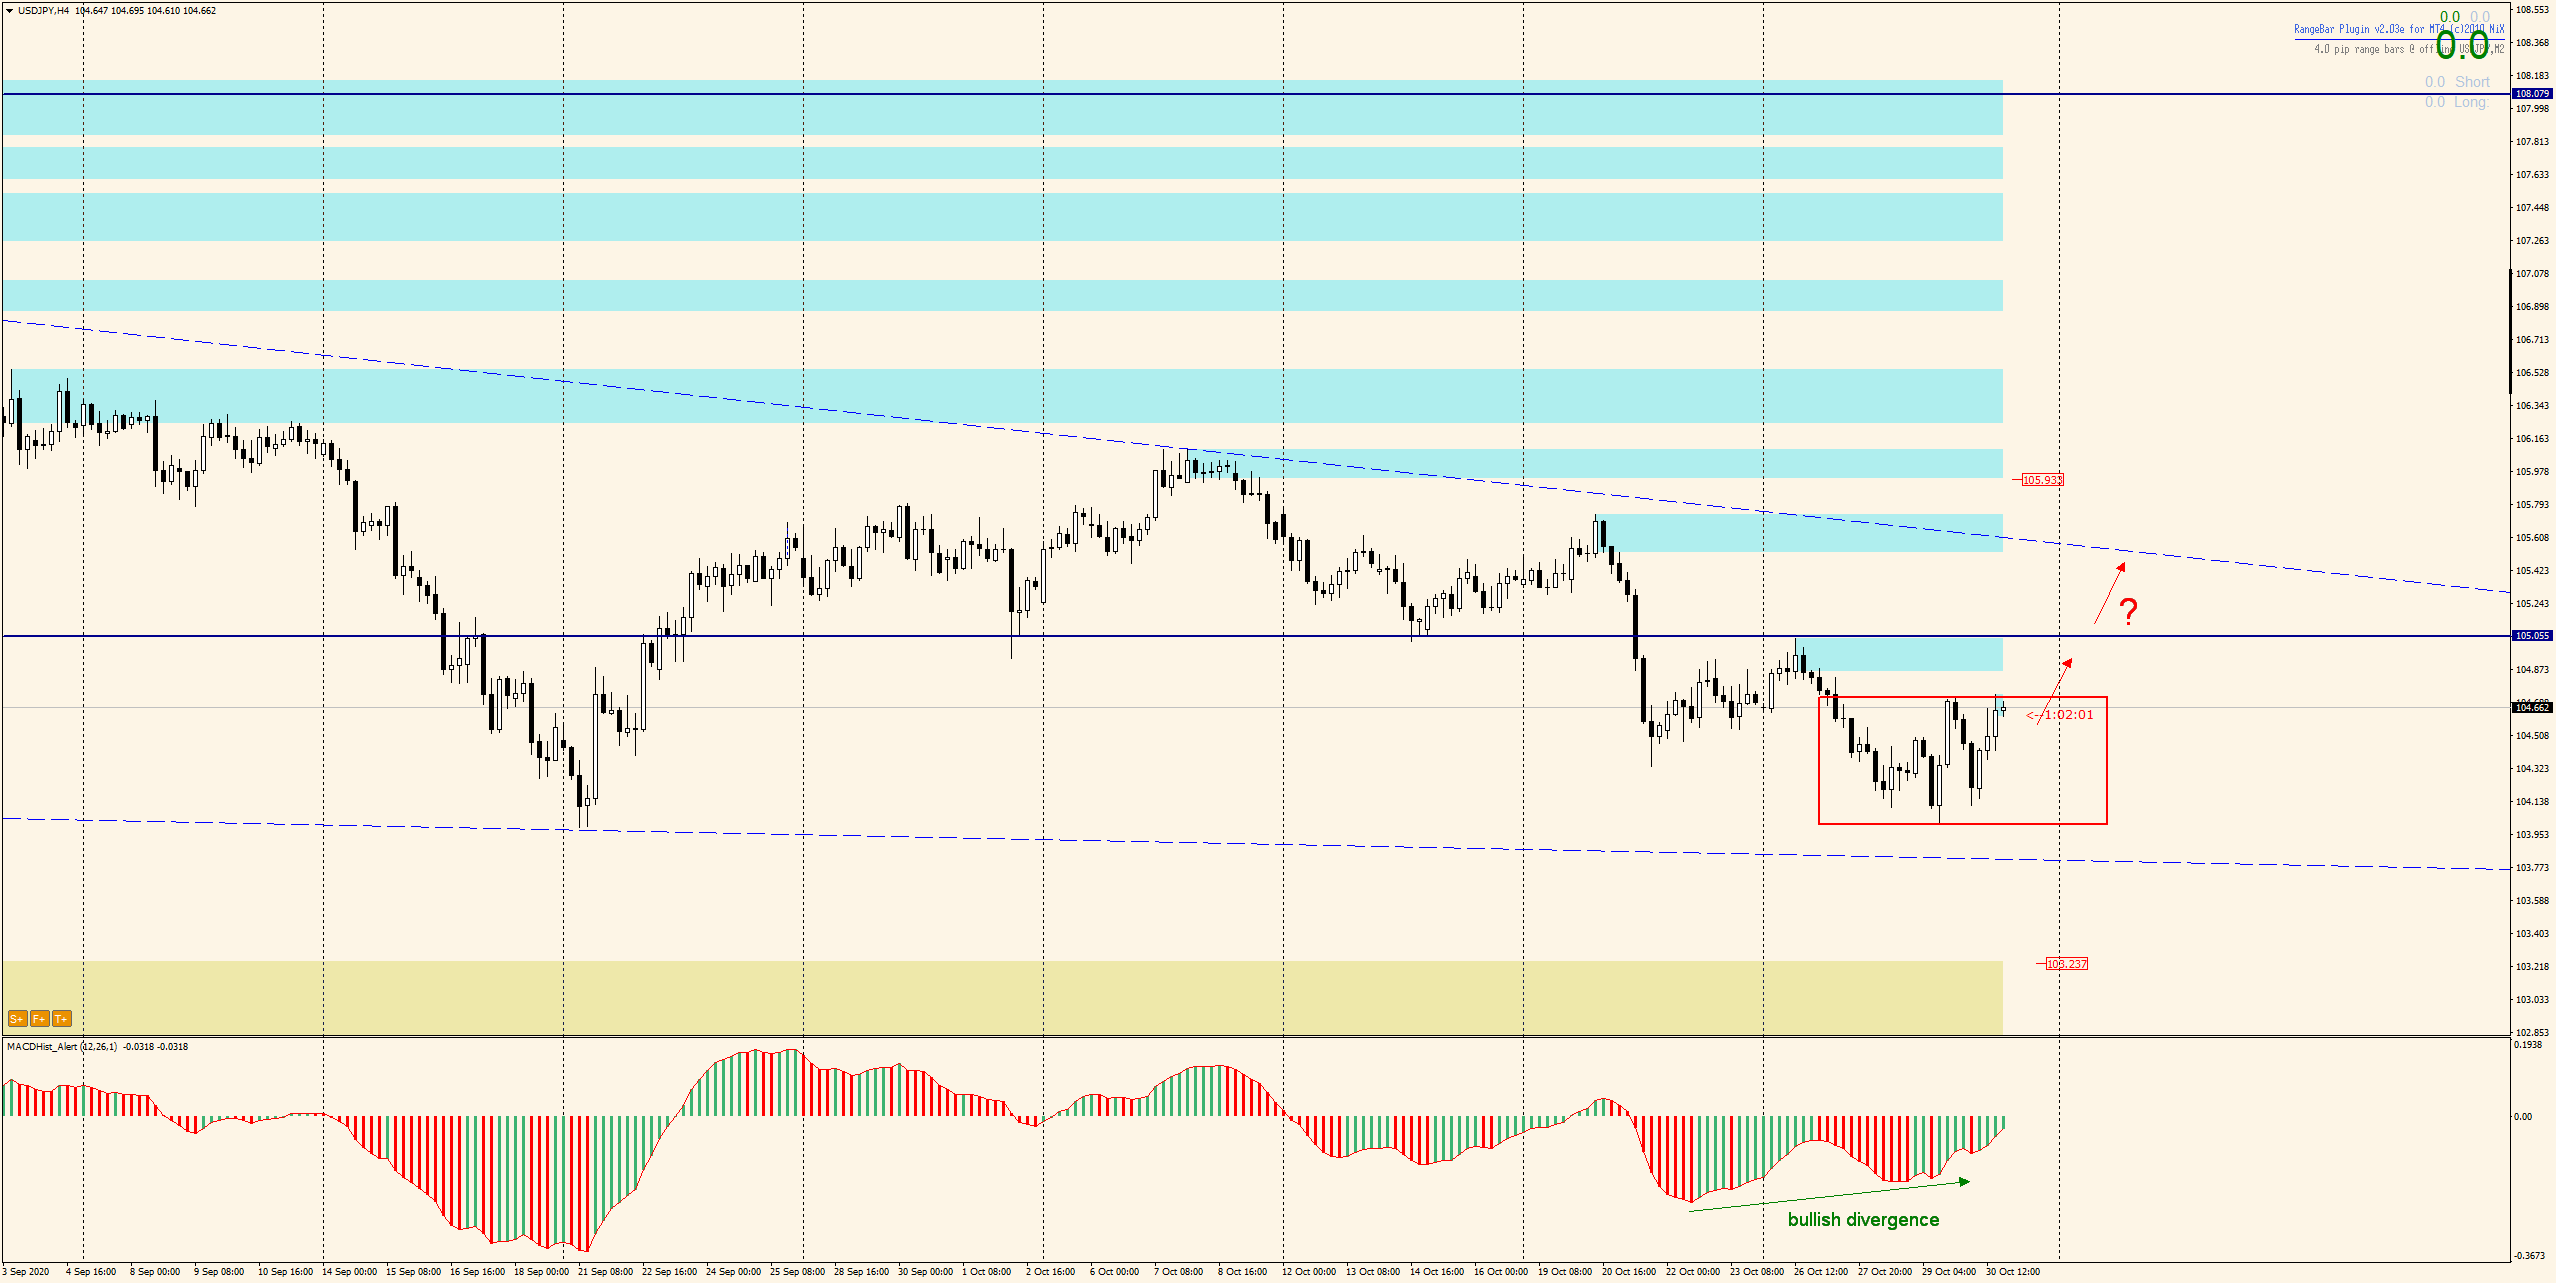
On the H4 chart, the situation also looks like breaking out of the formation thru the top is highly probable. The growth scenario is supported in this case by bullish divergence. The level of support and resistance 105.05 stands in the way in case of increases. Only when it is overcome can it direct the price towards the wedge resistance.
The upcoming days may be very volatile due to the presidential election in the USA and the USDJPY pair will be one of the most sensitive to news from the USA. It is worth taking this event into account when placing orders and selecting the volume, SL and TP orders accordingly.
I also recommend:
Trading with PA+MACD, or how to increase the probability of winning
ongoing analysis https://t.me/TradewithDargo
 In our Facebook group, which you can join anytime: https://www.facebook.com/groups/328412937935363/ you will find 5 simple strategies on which my trading is based. There, every day we post fresh analyses of currency pairs and commodities. You can also visit my channel where I post my trading ideas: https://t.me/TradewithDargo


 Review")


