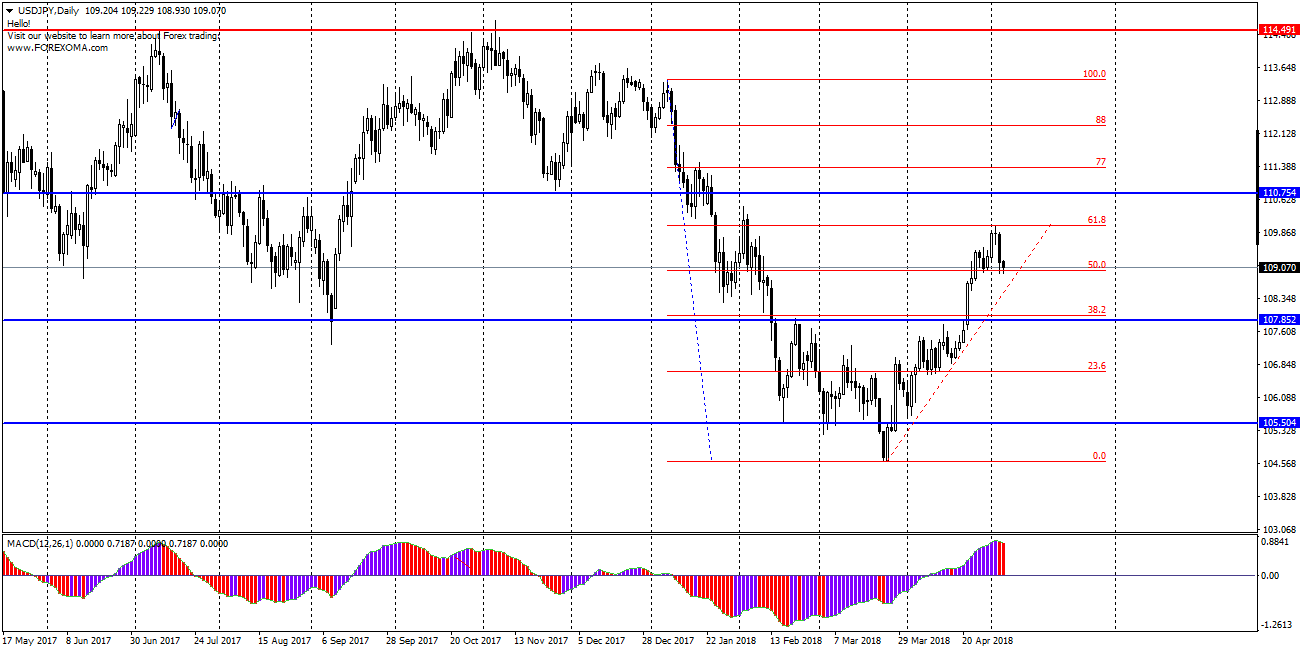
USDJPY – the pair from 23.03 moved in an upward trend and reached on Tuesday 110.00 growing 550p during this time. However, from two days we see that the supply, which appeared already on Wednesday, has an advantage and the price dropped by 100p this week. If you look at the situation on USDJPY in terms of Fibonacci levels, we can see that the maximum of this week was exactly at 61,8, from which declines began.
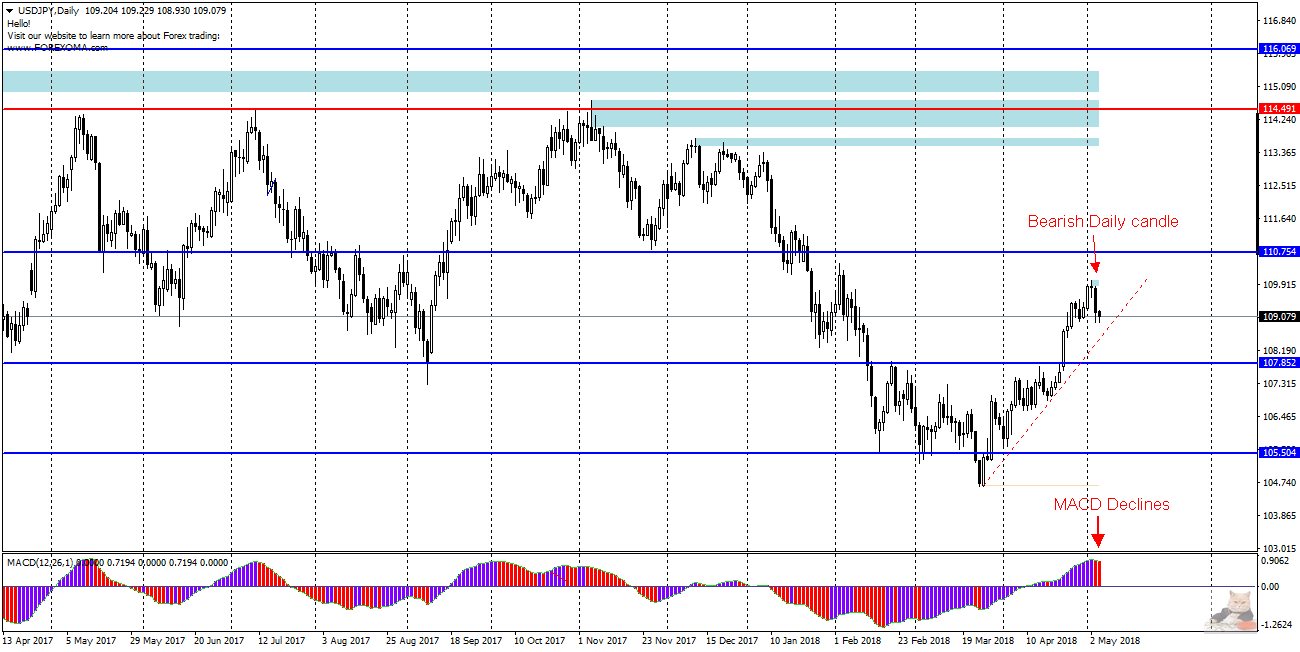
Looking at the chart in terms of Price Action + MACD strategy, we see that the value of the MACD indicator begins to decrease with the accompanying downward daily candle. It is also in line with the strategy assumptions that it would indicate declines.
The support for the downward scenario may be the situation on the H4 chart. This is where bearish divergence arose between the graph and the MACD oscillator, which also augurs the continuation of declines. Today at 14:30, we will learn about the results of employment in the non-agricultural sphere in the US (payrolls) which can cause high volatility in the currency market and this should be taken into account when planning to open an order on this currency pair.


 Review")


