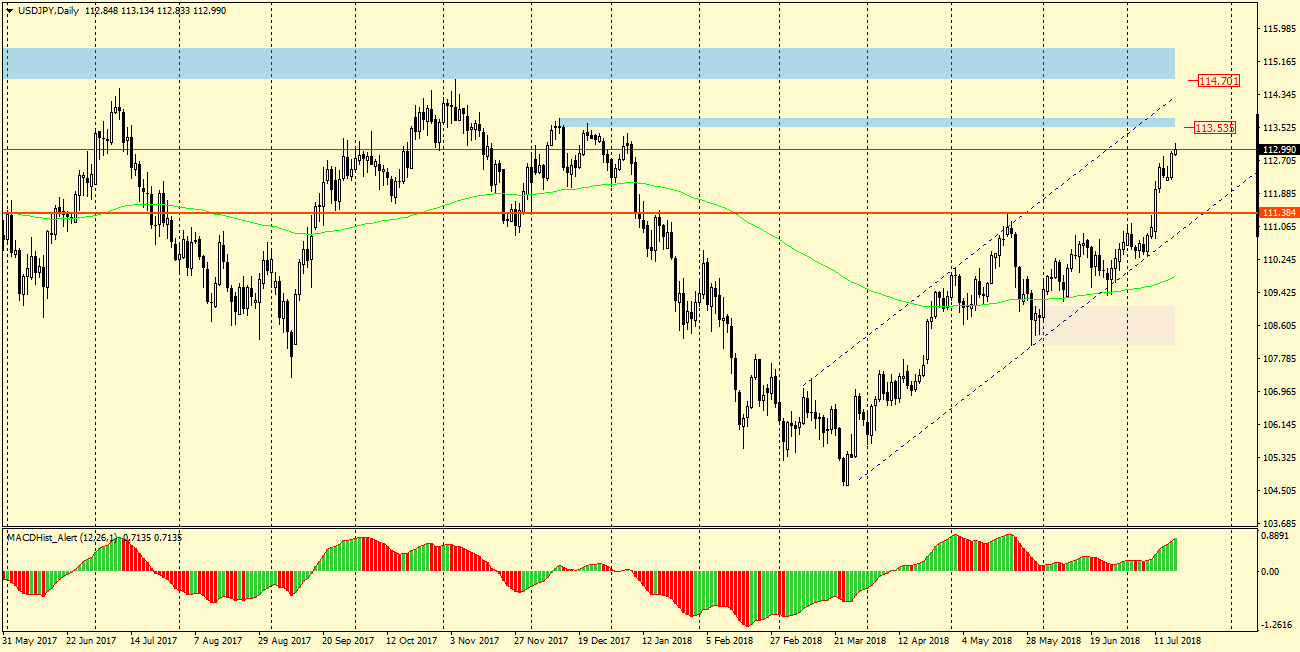
USDJPY – since March this year the pair moves in an uptrend. An important level of resistance in the area of 111.40 was defeated by a dynamic candle 10.07 and has not been tested so far. From the daily chart, we can conclude that the pair is aiming for 113.65, which at the end of 2017 was attacked three times without success and where a significant correction could occur.
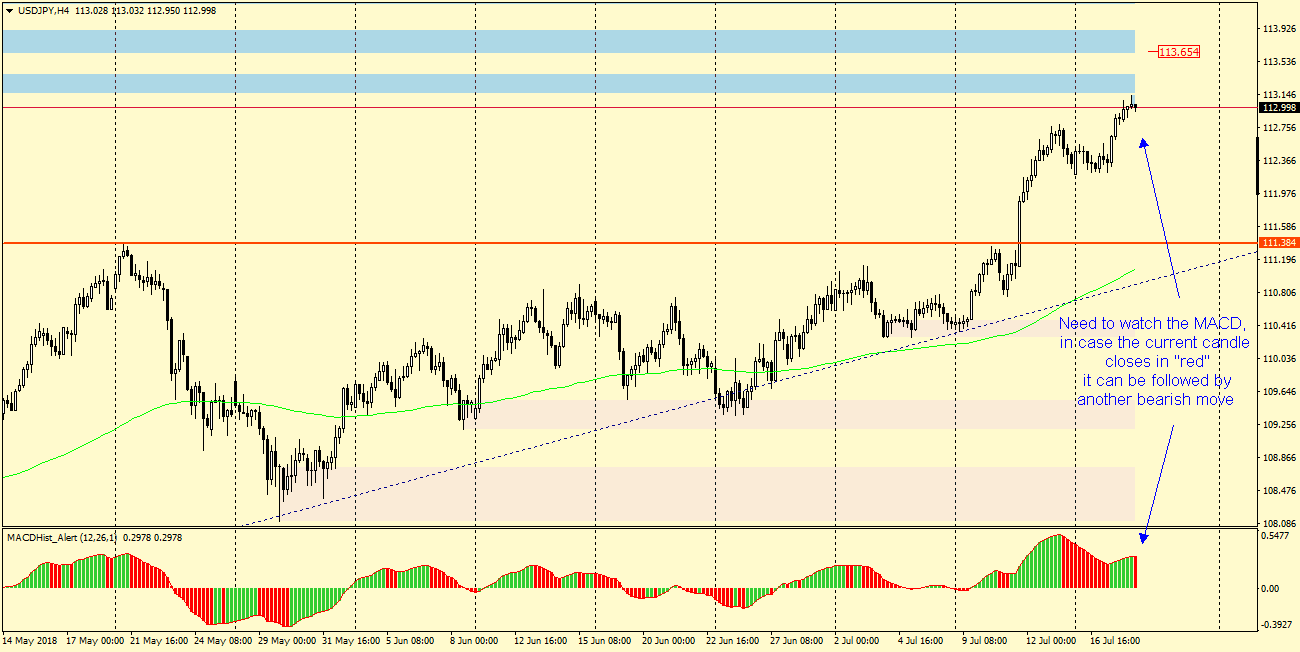
Looking at the H4 chart, we can see that today the pair reached local resistance 113.15. The MACD oscillator appears to form a top and if a 4-hour candle (12:00-16: 00) is bearish, there is a chance for further declines according to the PA + MACD strategy, the coverage of which is the closest support at 112.35. There will also be a bearish divergence between the oscillator and the price graph, which will be an additional support for the downward scenario. Because the pair is in a strong uptrend, this correction can be quite short (112.35?) And the pair will return to increases to follow the aforementioned level 113.65.


 Review")


