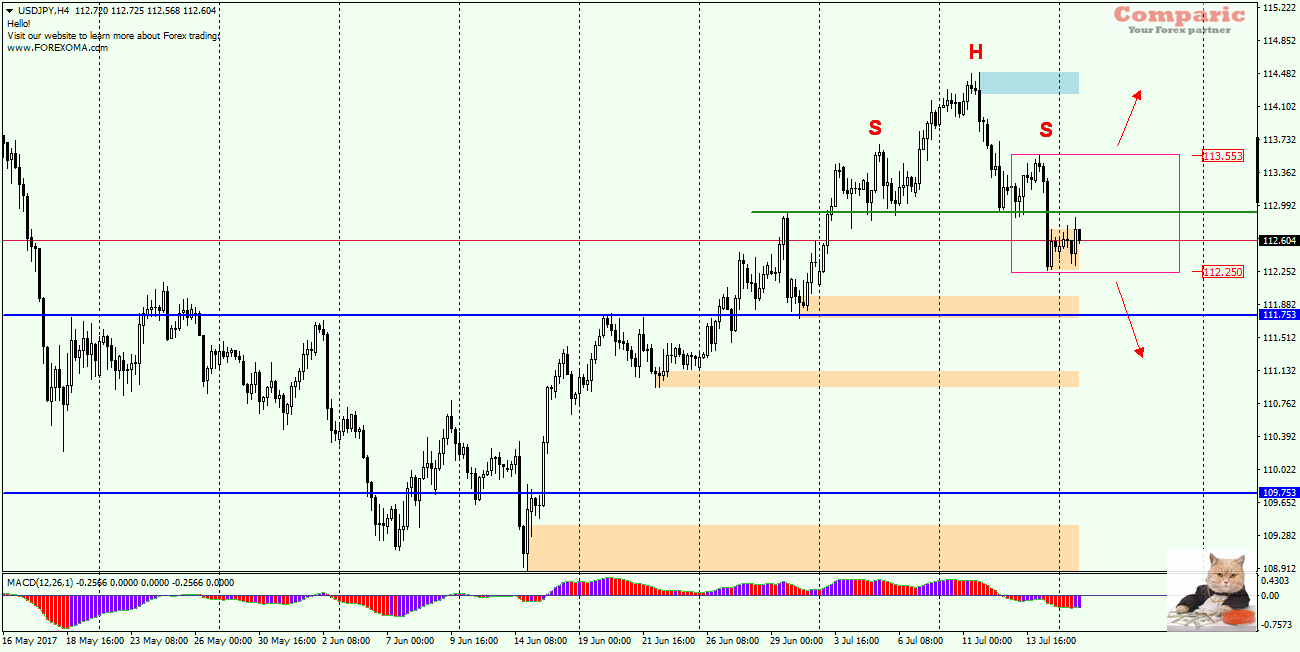
USDJPY – pair formed an interesting scheme of Price Action formations. H4 chart shows a clear Head & Shoulders pattern where the right shoulder was set in Friday’s Asian session at level 113.55. Then some time later at the end of European session, a large supply candle dynamically broke the neckline of the H&S formation (green line at 113.00).
Today, on Monday 17/07 there was a re-test from the bottom of this level and price is slowly retreating to the south. In this situation H&S is a bearish formation that promises declines that can have range equal to the height of H&S giving about 150 pips from the neckline.
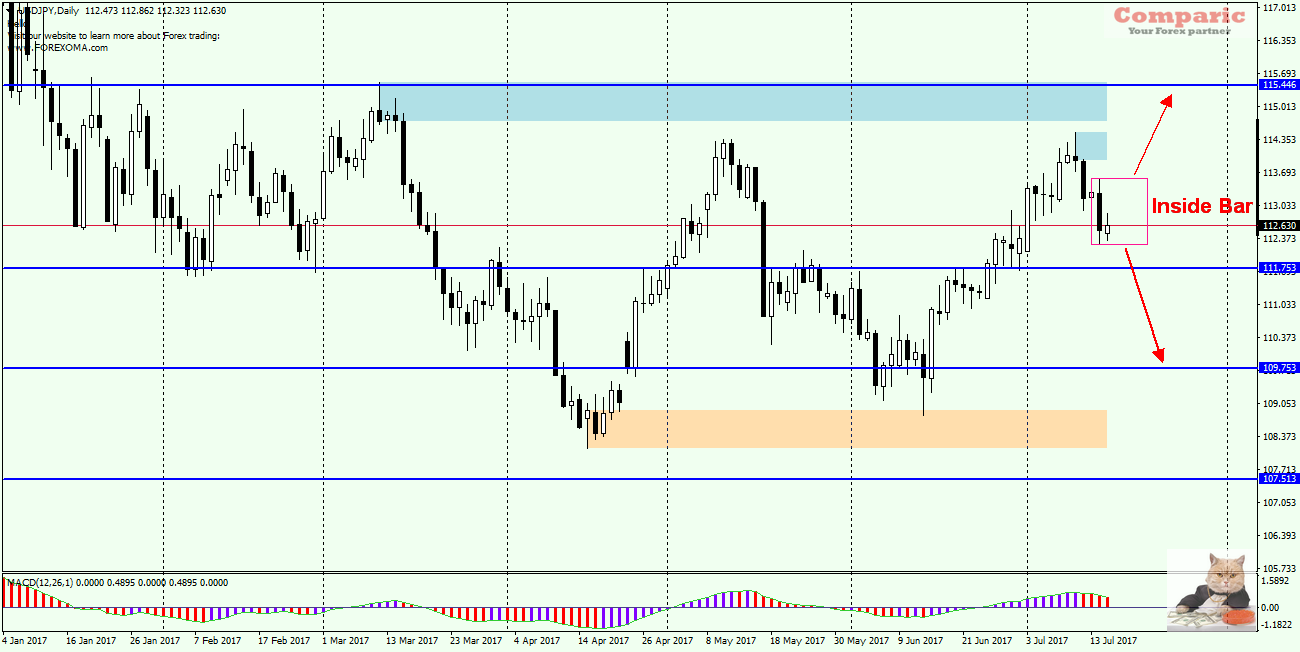
On the D1 day chart, we also have an interesting situation, as today’s USDJPY quotes are trapped in range of daily candle from Friday which set a Inside Bar formation. If there is a breakout down from the Inside Bar, we will have confirmation of bearish scenario and the USDJPY pair may reach 111.75, and if this level is broken, then next support is in the 111.15 area.
Of course, if price leaves the IB by its upper limit, which is also the level of right arm of the H&S formation, the downside scenario will be highly questionable and further growths can be expected.


 Review")


