Writing Monday’s (16.03) analysis I asked myself if, in such changing fundamental conditions, analyzing charts on the basis of Technical Analysis makes sense. The best way to find out if it does is by comparing conclusions from the analyses with the actual state of affairs… that is, how the theory based on “technique” has worked in practice.
I analysed three instruments – Gold, USDJPY and EURUSD.
GOLD 16-21.03.2020
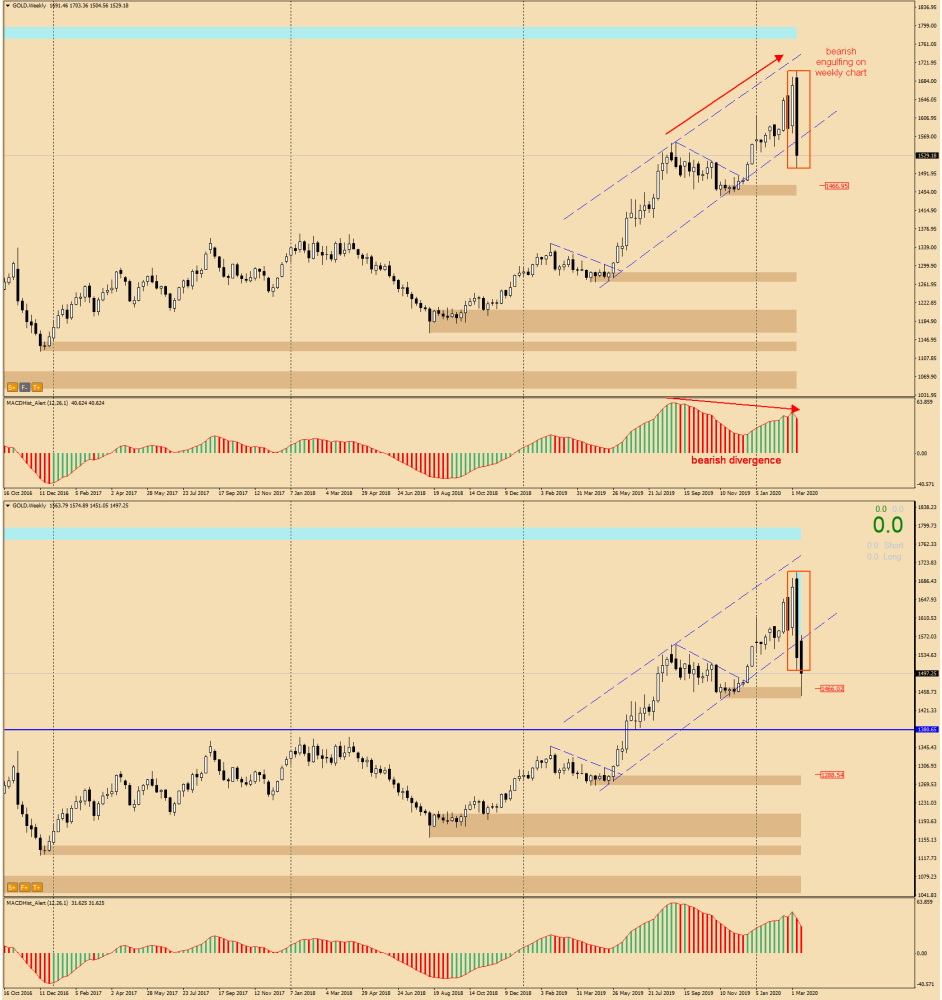
In the case of Gold, this was a continuation of the analysis from the previous week. On Monday, I wrote so: “Last week I analysed Gold and in the last sentence of the week’s summary I risked a statement, based on the technical situation on the chart, that this is not the end of declines on this metal… In a couple of sessions we will see if the next bearish engulfing on the week’s chart and the accompanying strong downward divergence have shown me the right direction (south) for this instrument”. The predicted declines were continued and the gold price stopped at 1450 $/oz in the demand zone marked on the chart. Here we can say that TechAn worked in 100%.
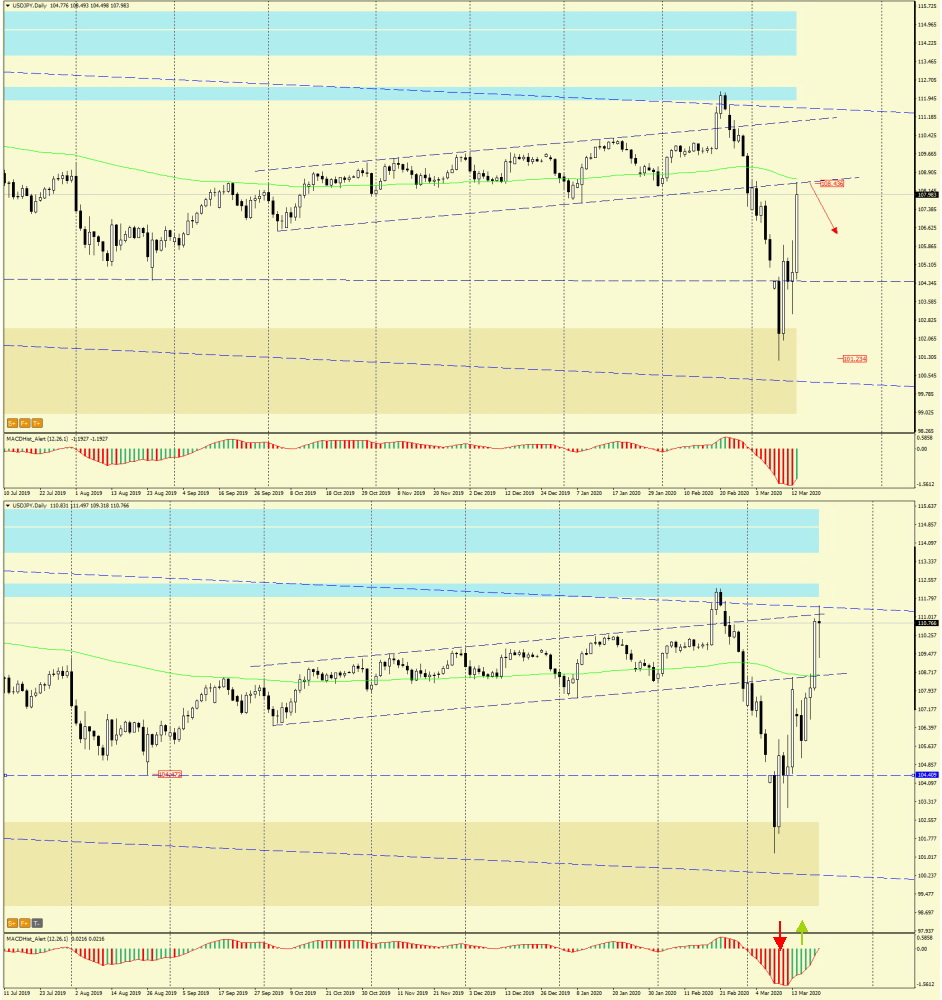
Monday’s second analysis – USDJPY – came out a bit worse. I wrote: “In early March, the price broke out from the growth channel and fell significantly to 101.20. At the end of last week, the declines were made up for and on Friday we witnessed a re-test of the channel’s defeated support, which is now acting as a resistance. The global situation indicates that there is a risk-off sentiment, i.e. an escape from risky investments to safe havens… which would indicate that after the re-test of the channel from below, we will see another wave of declines on the USDJPY pair, i.e. the strengthening of the Japanese Yen.”.
Initially, the yen strengthened and the pair fell by 280p, but since the Tuesday session, the yen started to lose more pips and the USDJPY pair rose to 111.50 by the end of the week. The question was whether this order of events could have been predicted, whether it was a mistake in analysis and AT proved helpless in the face of dynamic changes in the financial markets?
The task of my weekly summaries is to verify previous analyses and, if they fail, to look for the cause and draw conclusions for the future. The PA+MACD strategy, on the basis of which I make the analyses, assumes that when MACD changes direction (on the oscillator chart it is manifested by a change of colour of the next bar), one can expect a change of direction in which the price will move.
In the case of this analysis I did not pay attention to the fact that the MACD was at minimum and the indicator values started to grow. The next “green” bars on the MACD announced an imminent change in sentiment to the upward trend that had already occurred during the Tuesday session. We can summarize that after the opening of the Asian markets, Technical Analysis worked – 280p is quite a good result, but it was a mistake to assume that these declines will last several sessions… The MACD clearly signalled something different.
From Monday to Friday – Live trading at 13:00 (London time) chat, analyse and trade with me: https://www.xm.com/live-player/basic
EURUSD 18-21.03.2020
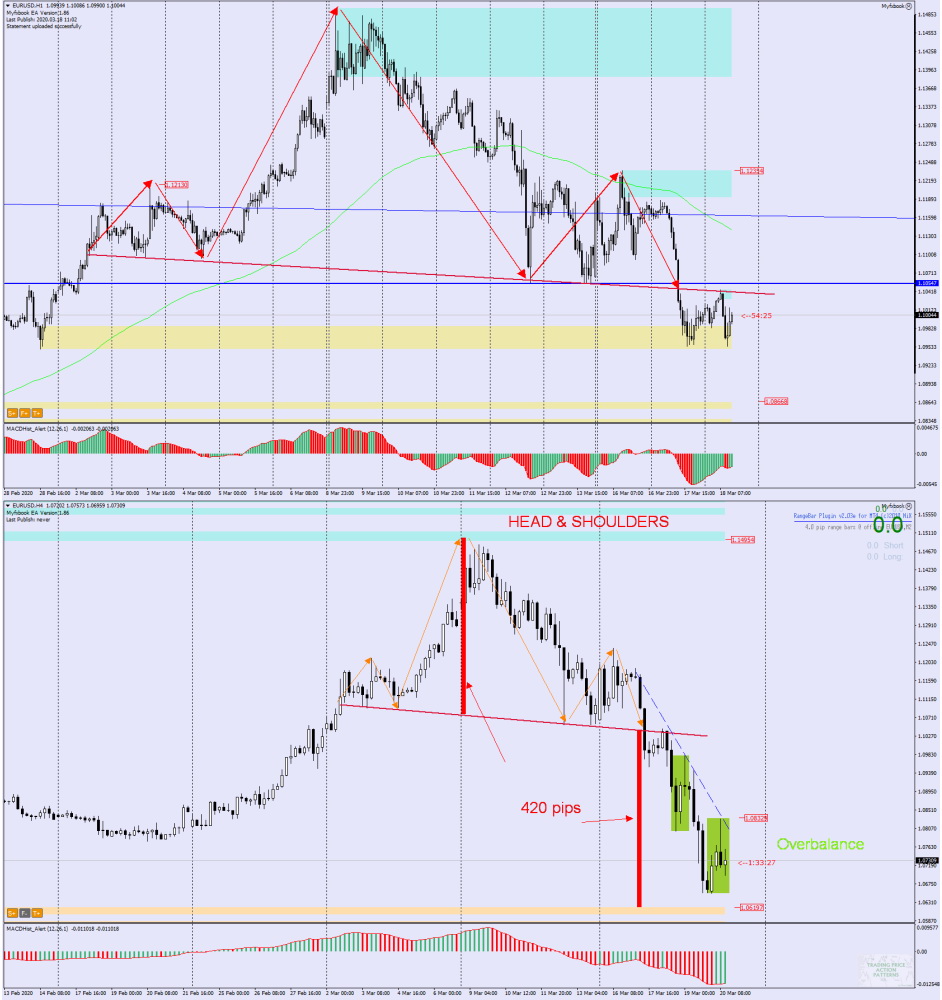
In the EURUSD analysis of Wednesday, I wrote: “This is particularly evident in chart H1, where the Head and Shoulders formation was clearly formed. The price has already crossed the neck line (red line), today we are observing its re-test. Everything points to a continuation of the declines to the closest support around 1.0860.”
In the case of this analysis, it is enough to look at the graph from Wednesday and the current one to state clearly – yes, here TA has proven itself 100%. On Friday, the EURUSD quotations reached the level of 1.0630, which is much lower than the one indicated in the analysis, thus realizing the rule that the dips after crossing the neck line are usually equal to the height of the H&S formation.
In our Facebook group, which you can join anytime: https://www.facebook.com/groups/328412937935363/ you will find 5 simple strategies on which my trading is based. There, every day we post fresh analyses of currency pairs and commodities


 Review")


