Wide View Strategy (WiViSt) is a typical trend following strategy. Purpose of this strategy is enter in transaction at the end of correction which is identified in strong trend (uptrend or downtrend). There are two intervals used in this strategy: m30 and m15.
Trend identification
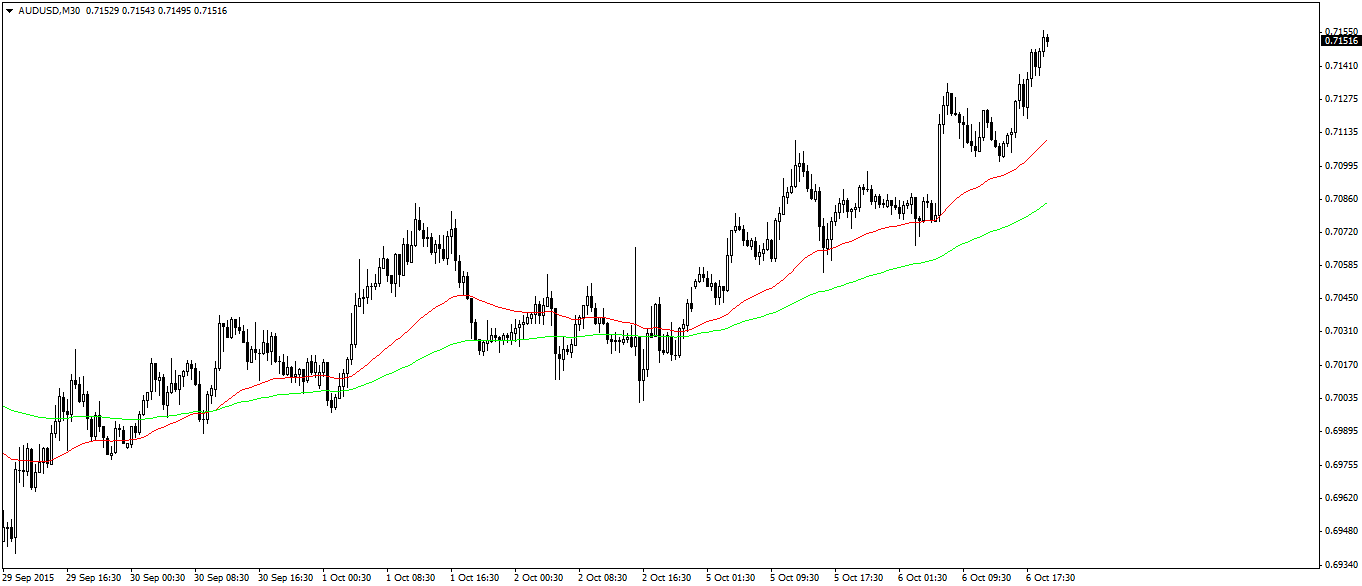
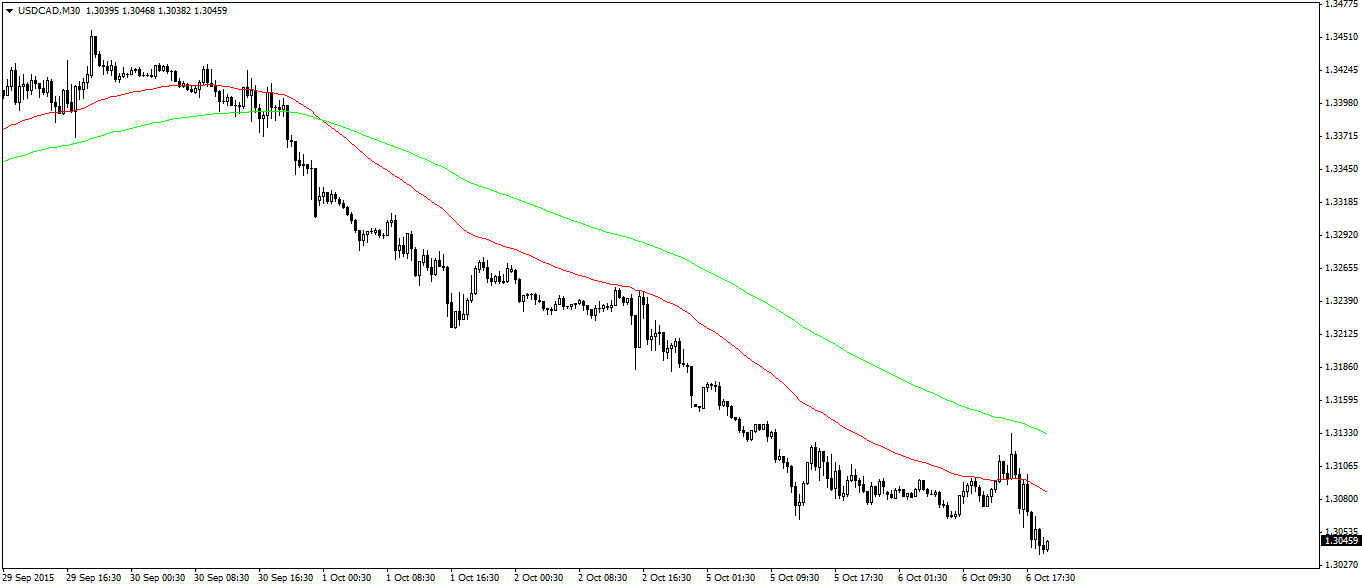
Trend identification relies on two exponential moving averages (48-period and 120-period). Those moving averages represent trend during last day (48MA on 30 minute chart), as from last 2 and a half days (120MA on 30 minute chart). Averages are matched to quotes on Forex market, where as we know trading is available 24h a day. For American stocks I use EMA 13-period and 33-period. If we want to use this strategy on other financial markets we have to remember to properly match those averages.
Observing the average to price, as well to each other, we make the first assessment whether it is worthwhile to follow the rate. The basis of trend identification is to determine its strength.
For this we will need tools and already mentioned our experience in the assessment of the market. To assess whether there is a strong trend we must assess the angle of moving averages. We do not need any fancy indicators or methods. Just that we have observed speed of moving averages. This can be assessed by looking whether the short-term average moving away from long-term one, confirming the trend.
If you have seen such a situation (like below), we go to the interval M5.
M5 chart configuration
Trend identification is already behind us. Time to set up a 5-minute chart, which will serve us to search for input signals in the position. We start by configuring indicators.
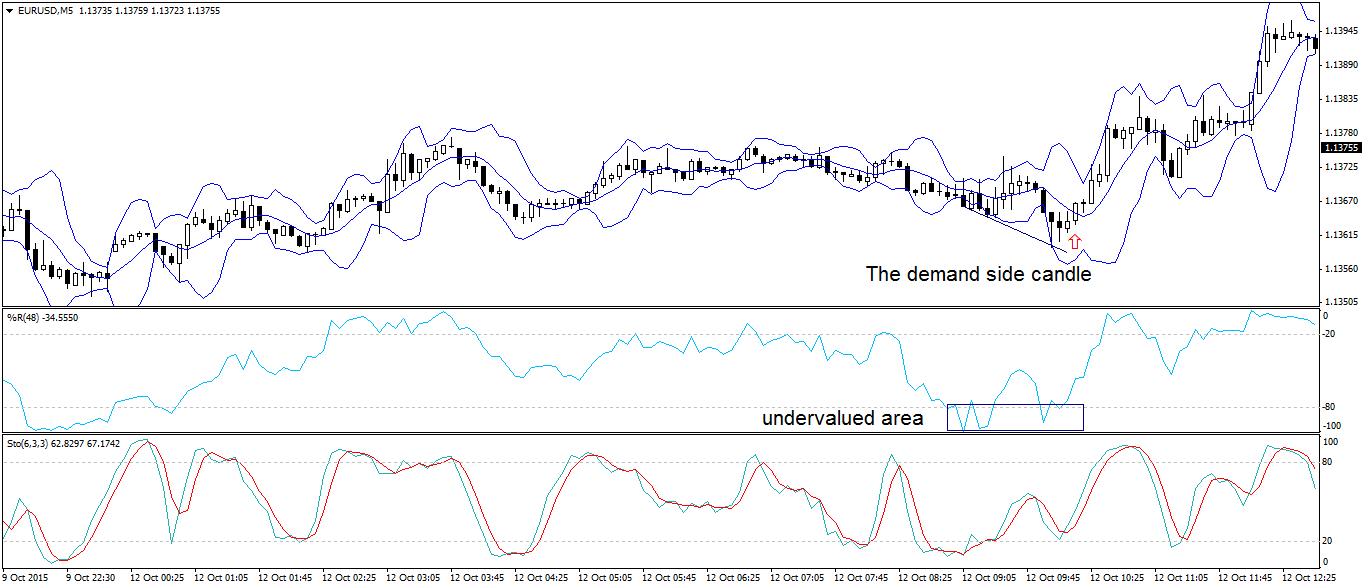
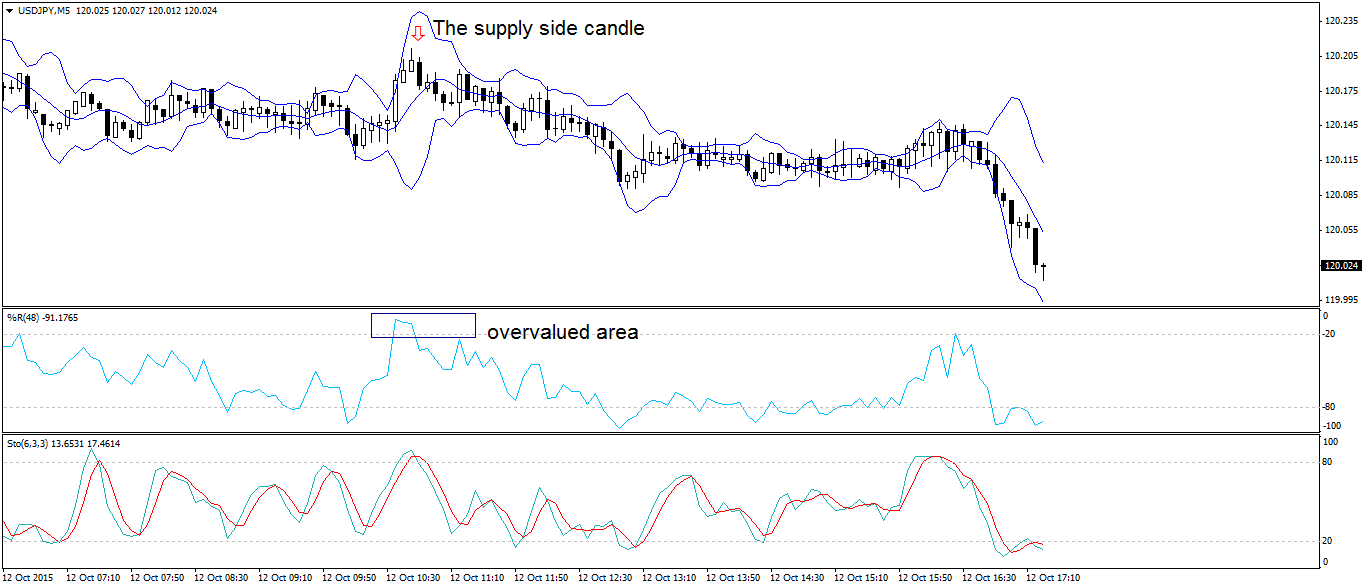
You should use the following tools on the M5 chart:
- Bollinger Bands (interval 6; deviation 3)
- Stochastic Oscillator (6,3,3)
- Williams Percent Range (interval 48)
In this way we have configured the chart. Therefore, we proceed to the most important – searching for the signals.
Generating signals
When the Williams Percent Range has reached the level of undervaluation or reframing (generating signals in accordance with the trend of higher order), we expect the emergence of a demand candle (%R are undervalued) or supply (%R are reframing). This candle must have a strong body and the closure should be near the highs (in the case of a buy signal) or close to lows (in the case of sale signal). At the same time the body of the candle should be higher than the last candle. If all the above are satisfied, we get a signal to take the position.
Risk management
The strategy involves the use of Stop Loss, Take Profit or Trailing Stop orders. The risk for one order should not exceed 0.5% of the capital and the size of the order should be adjusted to the level of Stop Loss, which as I mentioned should not exceed 0.5% of equity.
In order to adapt the Stop Loss order to prevailing market conditions, we use the Bollinger Bands tool. For purchase orders, Stop Loss should be placed below the lower band of the Bollinger Bands. In the case of sell orders, Stop Loss order should be placed above the top band.
Closing transaction (2 options)
- First option: As I mentioned, the strategy also uses a Take Profit order. It should be placed at twice the Stop Loss order (RR 1: 2). For example, if our Stop Loss is 15 pips, the Take Profit order should be 30 pips.
- Second option: An alternative is to use a Trailing Stop. This approach differs in that the primary TP (RR 1: 2) to close only half position. We strapped to the rest of the Trailing Stop order, which should be equal to the distance from the break even point to the first Take Profit level. Based on the example of “first option”, Trailing Stop should be 30 pips.
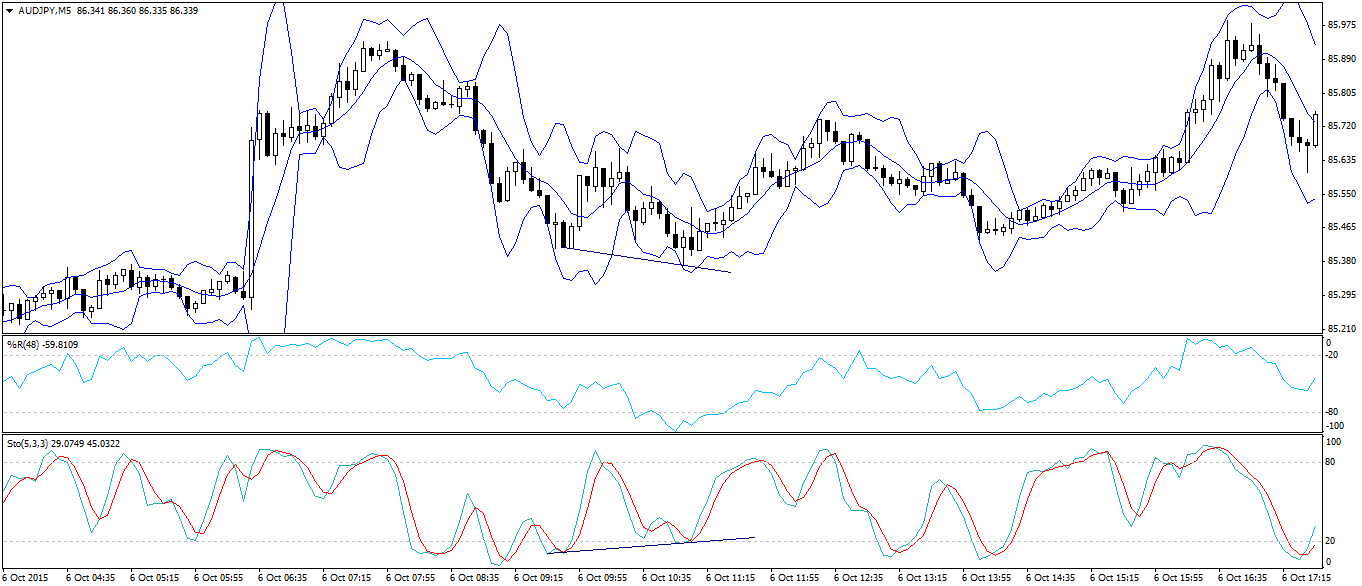
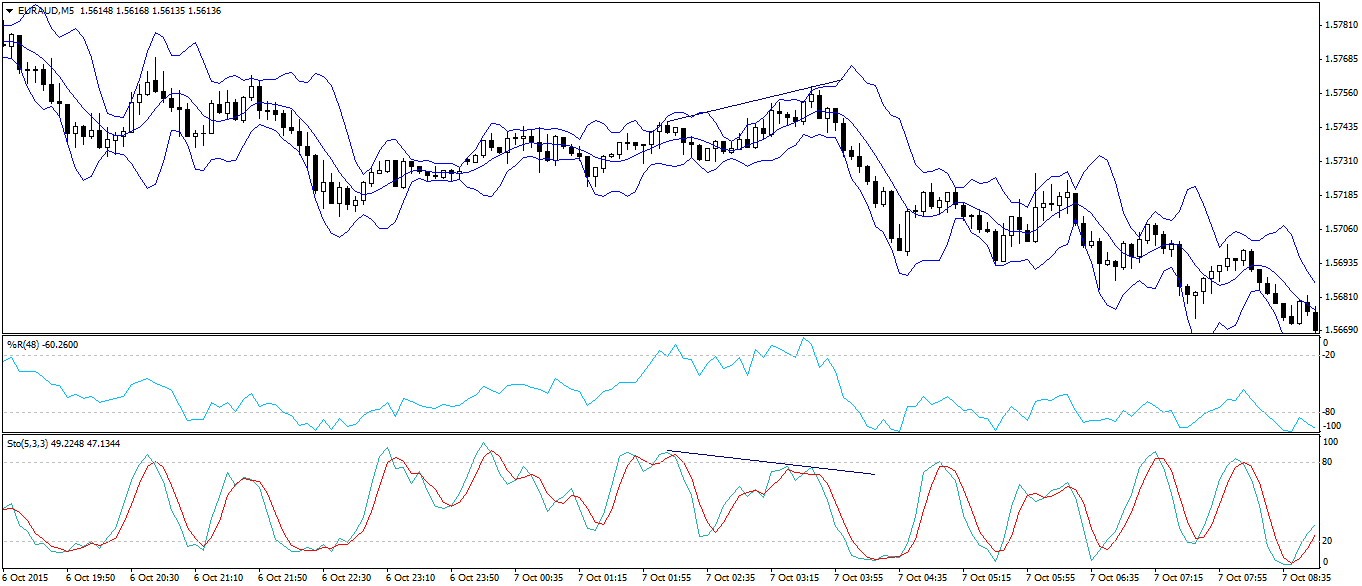
Additional filtering
The basics settings strategy WiViSt assumes the risk at 0.5% of the capital. However, we have an additional gate, if we want to increase the involvement of capital in position. However, this gate requires from us additional filtering signal – Stochastic Oscillator. On its basis, we determine divergence between price and oscillator. If such divergence appears, it is a signal to back to the higher time frame trend. Then we can afford to risk 1% equity.


 Review")


