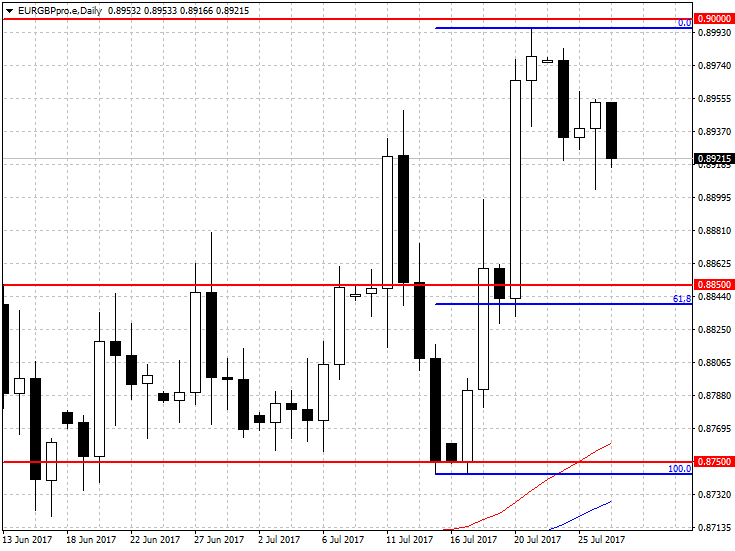
On EURGBP chart we can see dynamic gains and breaking of resistance at 0.8850. Strong growth candle from last Thursday led pair to set new highs. Currently you can see correction of recent increases. Strong support is in the vicinity of 61.8% of the FIBO abolition and a round level of 0.8850. A psychological level of 0.9000 is the closest resistance. It’s worth looking at the chart with a lower time interval.
Access some 200 financial instruments with Noble Markets >>
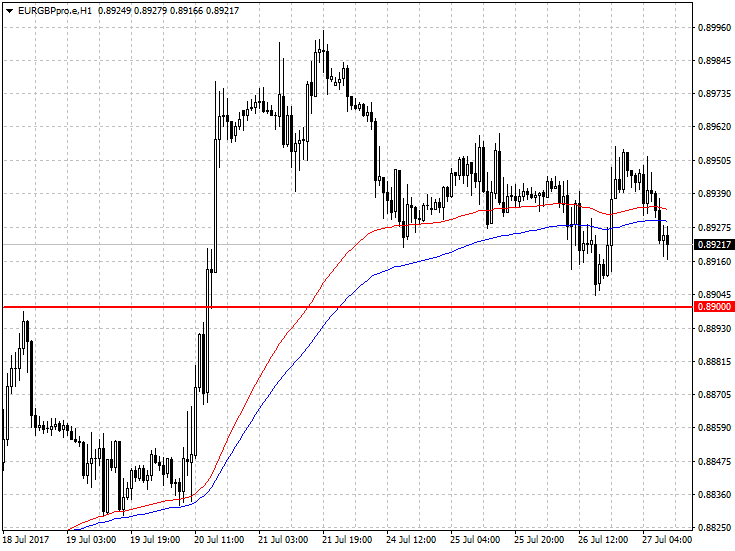
On H1 interval chart price is approaching round level 0.8900. Test of the aforementioned area together with bullish signals can finish correction movement and lead to increased demand. The lack of response from buyers will probably prolong the correction and lead to further declines to next support area around 0.8850.


 Review")


