Wide View Strategy (WiViSt) is a typical trend following strategy. Purpose of this strategy is enter in transaction at the end of correction which is identified in strong trend (uptrend or downtrend). There are two intervals used in this strategy: m30 and m15.
GBPUSD:
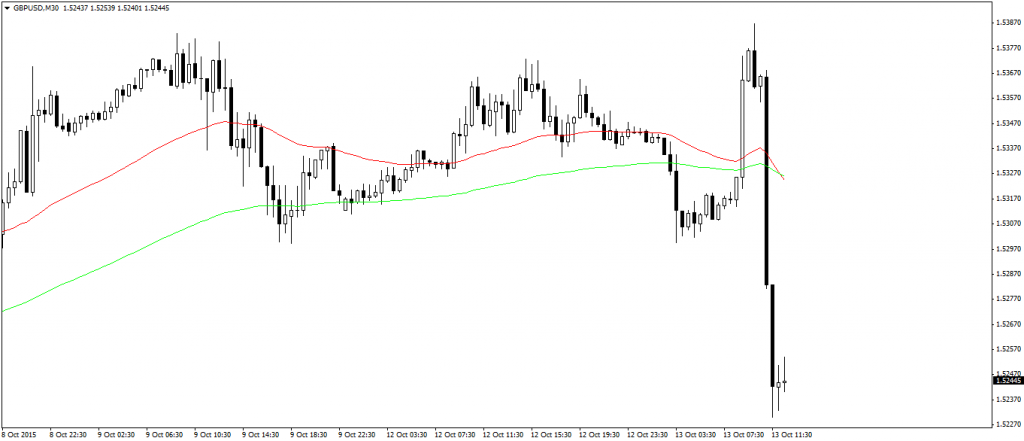
After CPI data in UK Pound Sterling is weaker. He is depreciating also to the USD. We can observe intersection of two averages (48 and 120 EMA). When the averages start to „accelerate”, we will be looking for some sell opportunity on M5 chart.
EURUSD:
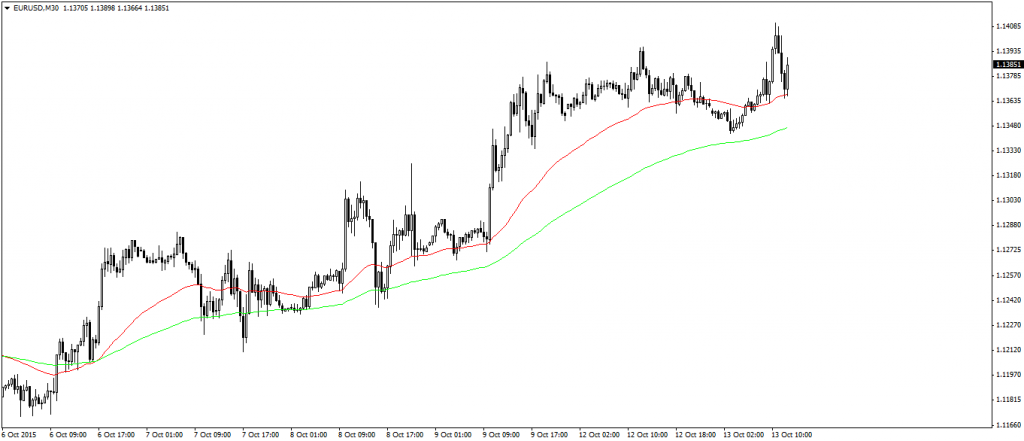
On EURUSD demand is dominating this instrument, so we go the M5 chart.
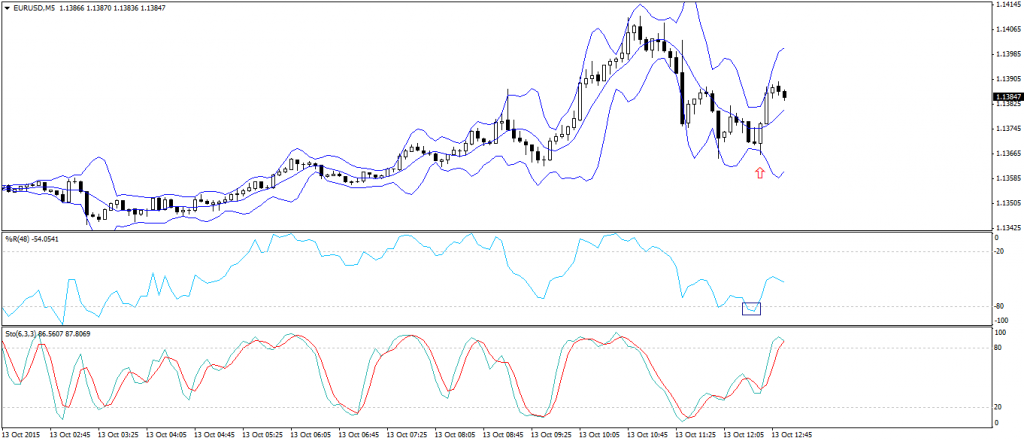
We had buy signal on M5 chart, as also we can see the divergence between chart and Stochastic oscillator.
Analysing currencies on M30 chart, we are using EMA averages (48 and 120 period). In case of american stocks trend is determine by 13 and 33 period EMA on M30 chart. This is due to a lenght of american session. Parameteres on M5 are the same as on currencies.
BOEING:
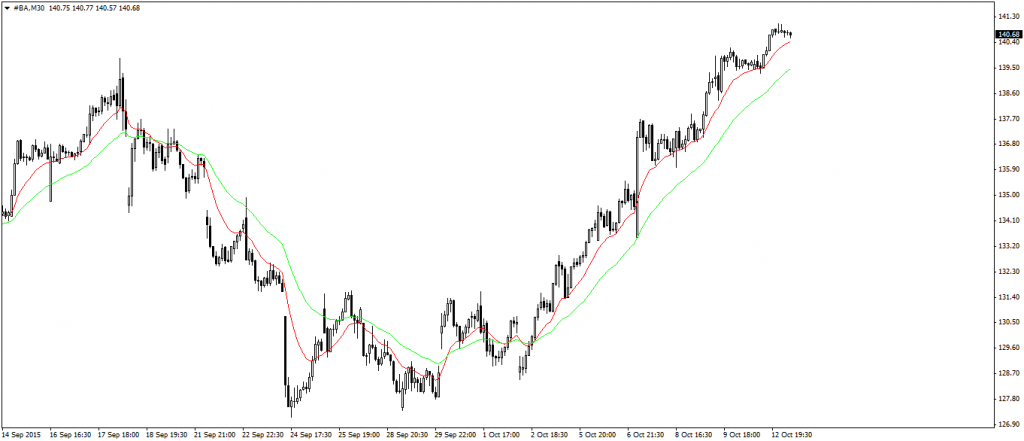
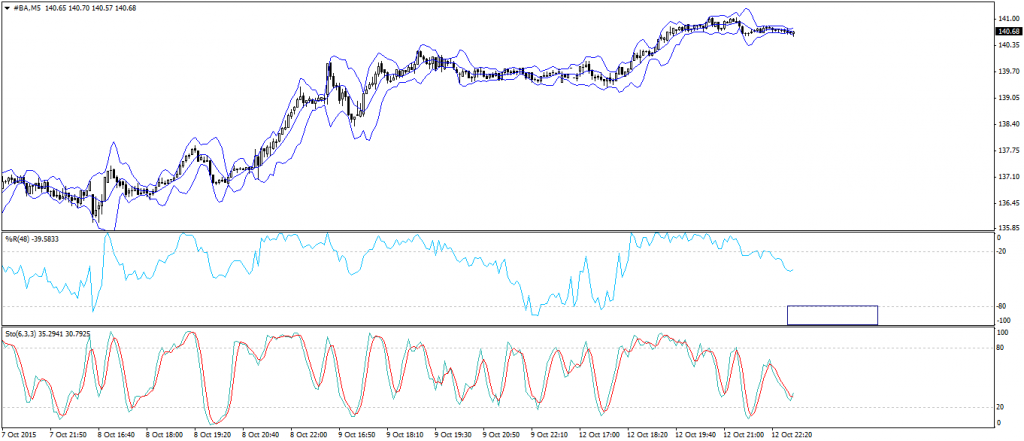
Boeing is in down trend, that is why we go the M5 chart.
When %R come to the undervalued area, he will make an opportunity to the long position.


