Last week I tested a 60 second strategy for ADX EMA. As the name implies, this strategy uses two indicators: ADX (Average Directional Movement Index) and Moving Average. As it turned out, instead of profits, most of the signals caused losses. These were so great that I found it a shame to waste another week continuing this “experiment”, so I am breaking tests and from Monday begin testing another strategy which I called ADX EMA II . Well, maybe not the indicators are wrong but their interpretation ? One of the readers shared with me his views on this strategy and I found it worth checking out a different approach to the indicators.
Statistics speak for themselves
The numbers do not lie. During the past week, between 8:00 and 12:00, the ADX EMA generated a total of 447 signals on the observed currency pairs. Only 215 of them turned profitable and as many as 232 lost. This means that the efficiency was at 48.10%. Taking into account the return on investment that uTrader trades between 70% and 73% in total, we would lose 79,39: 1 in 447 transactions.
New, old strategy
So far, all the signals were generated basing on intersection of price with EMA28 and the ADX indicator served as an additional confirmation. In the new version, the strategies will be reversed: this means that intersect of the averages ADX will give potential signals and EMA28 will only serve as a filter.
All indicators settings remain unchanged. You can check them under this link.
CALL OPTION – GROWTH
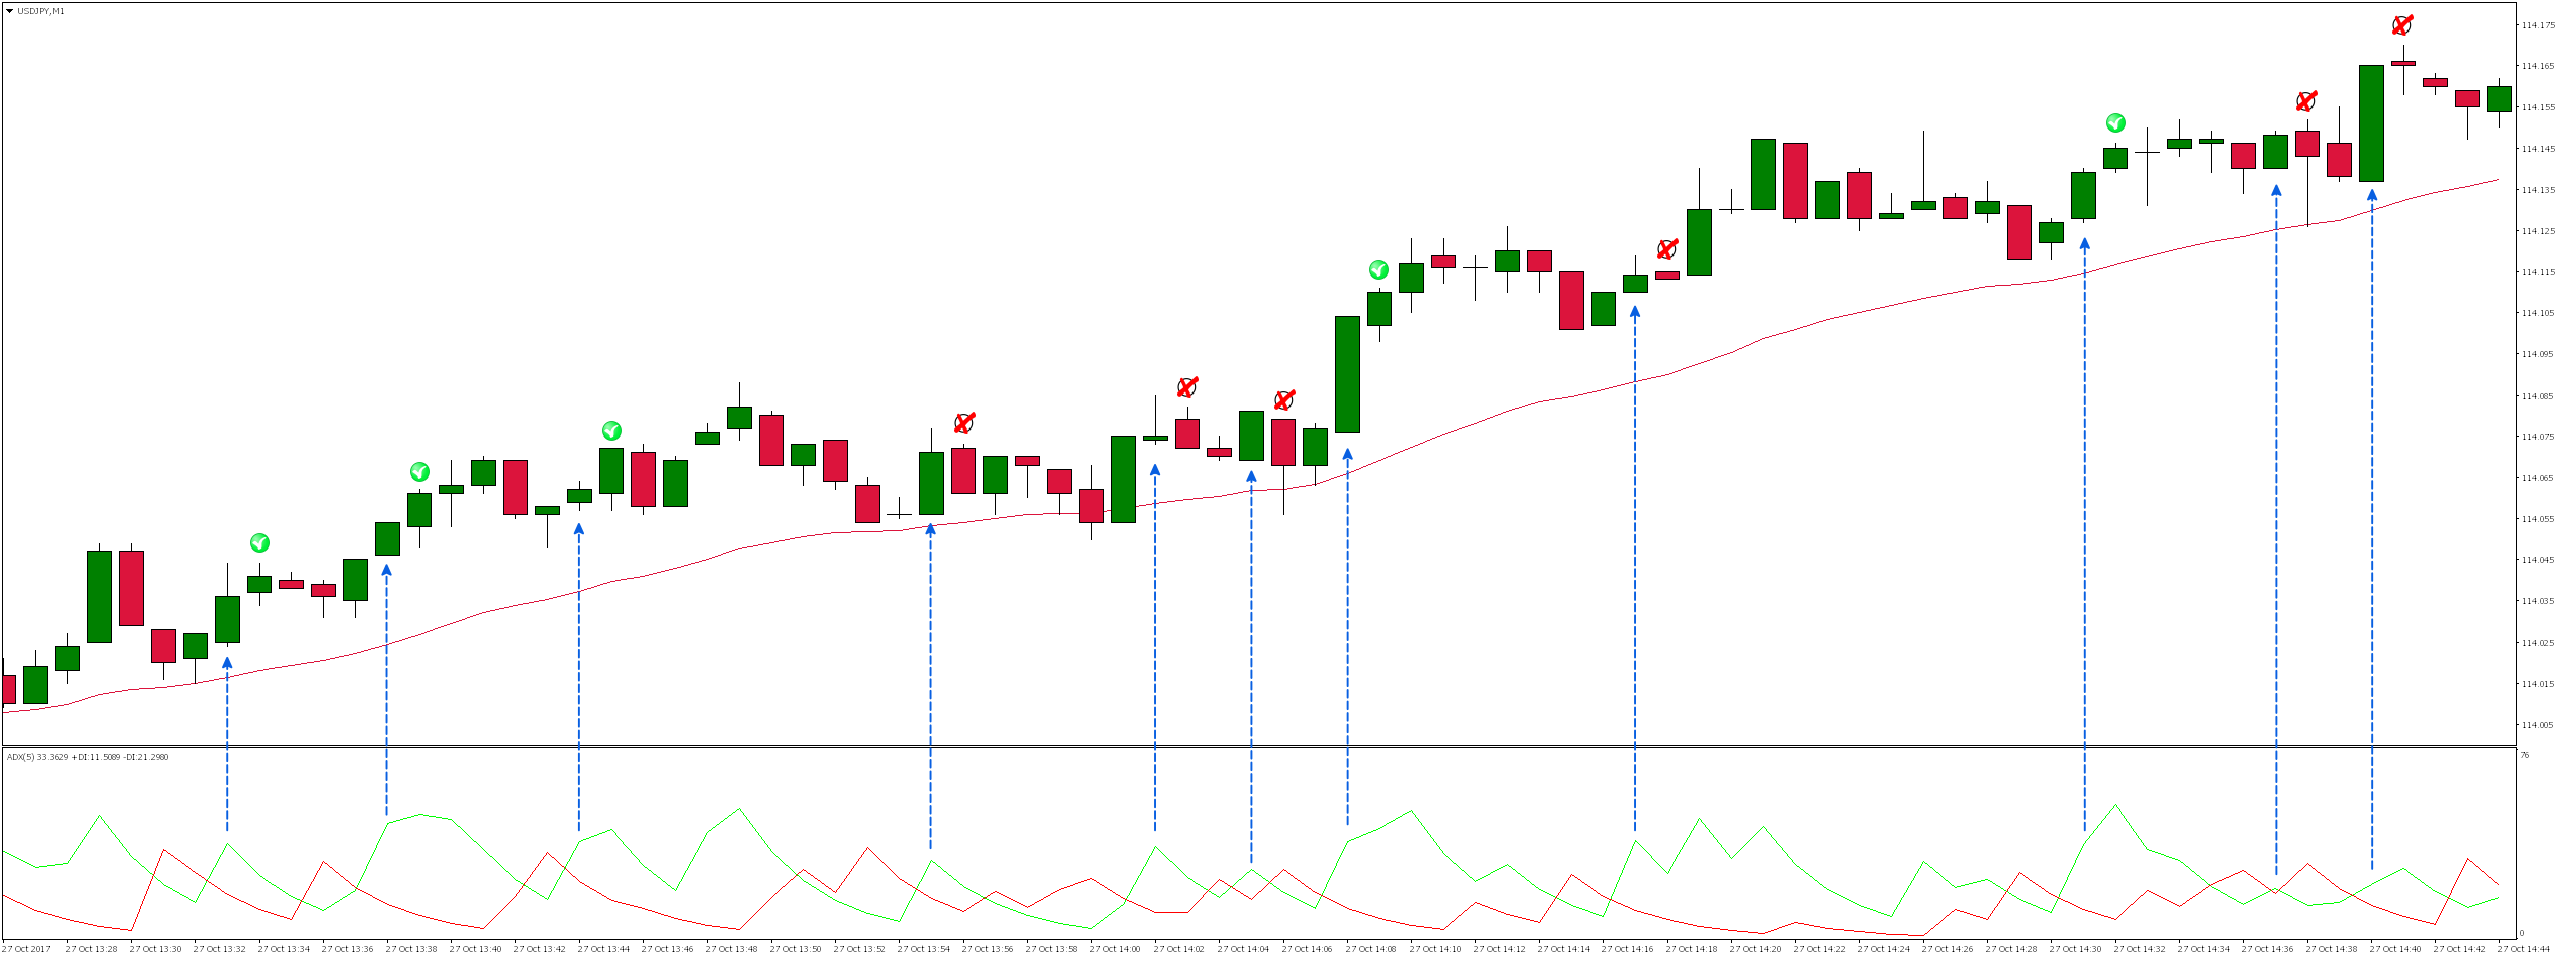
In the case of a 60 second ADX EMA II strategy for CALL, we decide when:
- The green ADX line crosses from the bottom the red one
- The price is above the moving average of EMA28
- The body of the signal candle is bullish
 PUT OPTIONS – FALL
In the case of a 60 second ADX EMA II strategy, we decide on the PUT option when:
- The red line ADX crosses from the bottom the green
- The price is below the moving average of EMA28
- The body of the signal candle is bearish


