 LONDON. Dr. Dariusz Swierk, Editor in Chief of New City Trader, a magazine for professional traders, says that several factors indicate that we may be seeing the final phase of market manipulation on BTC. Strong rises are likely to follow soon.
“I have worked for many years with many prominent traders, some were real geniuses of the markets, and I have learned their tools.
The current situation is interesting in that many of the tools that the big traders are using are pointing to the same thing – the end of the declines and a market reversal.”
Ten factors point to possible reversal in BTC:
The first five arguments are based on knowledge revealed several years ago by a trader who was a member of a syndicate that manipulated the stock prices in the US. The syndicate paid attention to the relation between the price and the volume, as well as to the news that accompany the drops.
The next four arguments are the behavior of indicators used by the largest institutional traders. Virtually all four point to the existence of a strong support zone at levels between 20,000 – 22,500.
The last argument is the strongly growing interest in BTC and crypto in general among the wealthiest group of investors (albeit little known) – Family Offices.
The charts are available at the link at the end of this note. Each argument is also discussed in more detail.
Below are the 10 arguments:
- The behavior of volume in the decline in the period from March 28, 2022.
The decline in volume (relative to previous periods) indicates that the largest traders are not in this move. This volume behavior is typical of corrective movements.
Chart: Low volume in recent declines (green arrow at the bottom) – usually such volume characterizes corrections.

- Volume behavior over the last few days.
Starting around May 9, there was very high daily volume for several days. Usually such an increase means that the biggest traders have started buying.

- Syndicate traders were paying attention to several volume formations ending moves.
Perhaps half of one of the major formations has already been drawn. High volume is already around May 12. Perhaps there will be lower volume lower around 22k – 20k. Such a formation will mark the possible end of the declines.
Chart: what does a volume reversal pattern look like at the end of a correction?
Let’s look at the earlier correction in mid-2021 (two green arrows in the middle of the chart).
The right arrow – indicates clearly lower volume. Price has gone about $150 lower than before (there is a new low – however it is hardly visible at this scale). The new low is made on lower volume.

A formation similar to this can be drawn now, it is quite common in the markets. Then it will look more or less like this (I drew some additional volume bars beyond the current chart): 
Look at what happened after the previous volume reversal pattern. The market stayed in a sideways trend for a few days and then moved up strongly.
- The biggest traders are used to buying on dips.
The biggest investors are used to buying on dips. They have so much cash at their disposal that they can stop a falling market when they think the price is right. Their presence is signalled by a high volume.
Look at the last chart above.
Left arrow – there is a huge down candle with a large volume. Market declined but someone bought a lot of BTC.
Huge volume means that pros are present. Retail traders are too afraid to buy during a huge decline.
- News about BTC is close to panic.
Bad or catastrophic news at the end of declines – is a factor of influence on the psyche of investors. The idea is to scare them out of the market so they sell what they own. Currently we have a concert of negative news about BTC and crypto in general.
Below, I will try to answer the question at what levels the market may reverse.
- Strong support zone 1: commonly used by major institutional traders SMA 200 is just below.
Historically used as a primary tool for trend identification. It is currently running below the price at around 22,500. This is where we can expect a stronger reaction (such as we have seen before with that tool).
The use of the SMA 200 average has a very long tradition. At least a century old. It has been one of the main tools for determining the long-term trend.
Here, by the way, one remark: one should not approach any tool as working always and everywhere. It is very important to see if the tools in question are currently working – that is, if they are currently being used by key investors. 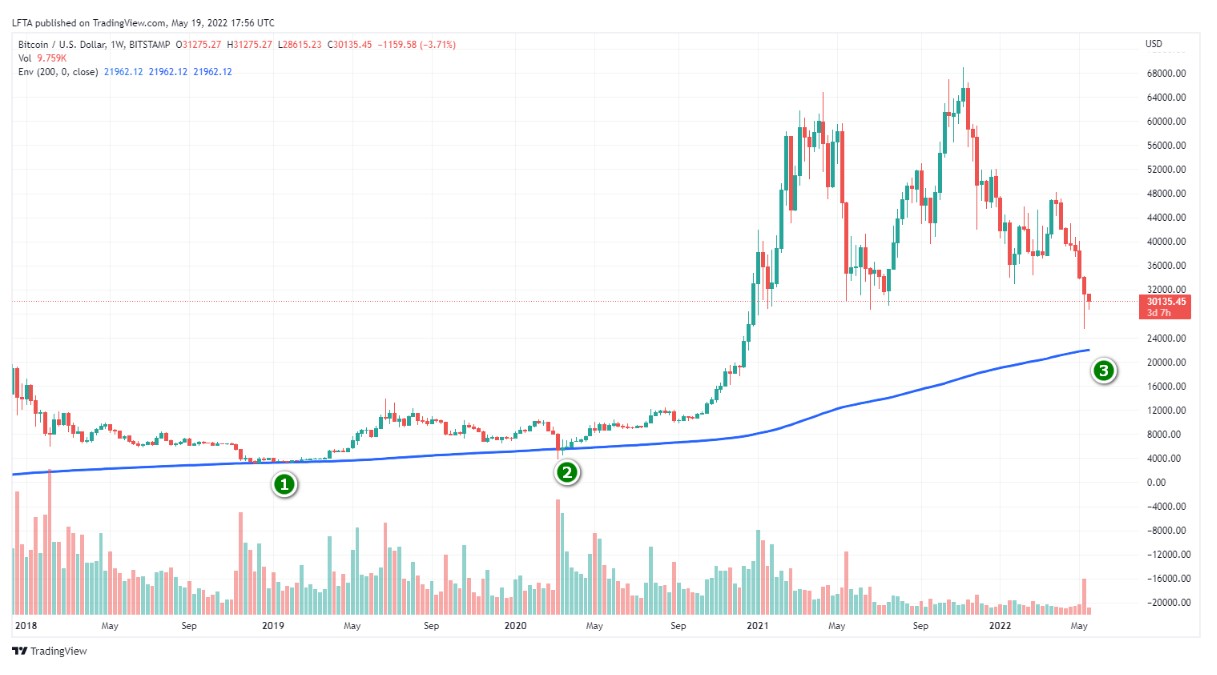
How did it work before? In points 1 and 2 we see that it worked. On a side note: this could also mean that the big investors were already there.
Additionally I checked on D1, it works quite well.
- Elliott wave analysis indicates a correction is nearing completion.
According to another tool often used by the largest investors – Elliott Waves, we are near the end of the corrective decline. The typical range of the last arm of the correction ends around 22 500 -22 500.
Three main conclusions from the wave picture on BTC:
– The current move down is most likely a correction.
– We are near the end of the correction.
– The final downward move – “wave five” – is still missing.
Let’s look at how this looks on the chart:
- Strong Support Zone 2: The Envelope
One of the interesting tools of the biggest traders and funds are envelopes. They allow you to very quickly assess whether the price has moved too far from the chosen average.
I tried to find where such a reaction could occur. I tried to choose both the average and the width of the envelope. The width is best chosen by studying the reactions to the envelope in the past.
The boundary of the envelope that has worked in the past is around 22,000.
Envelopes have always been important, their importance has increased in recent years because of automated systems (large quant funds use them frequently). In short, they work like this: if the price moves too far away from the average – it triggers an automatic reaction from the algorithmic systems.
With this knowledge let’s look at the chart below.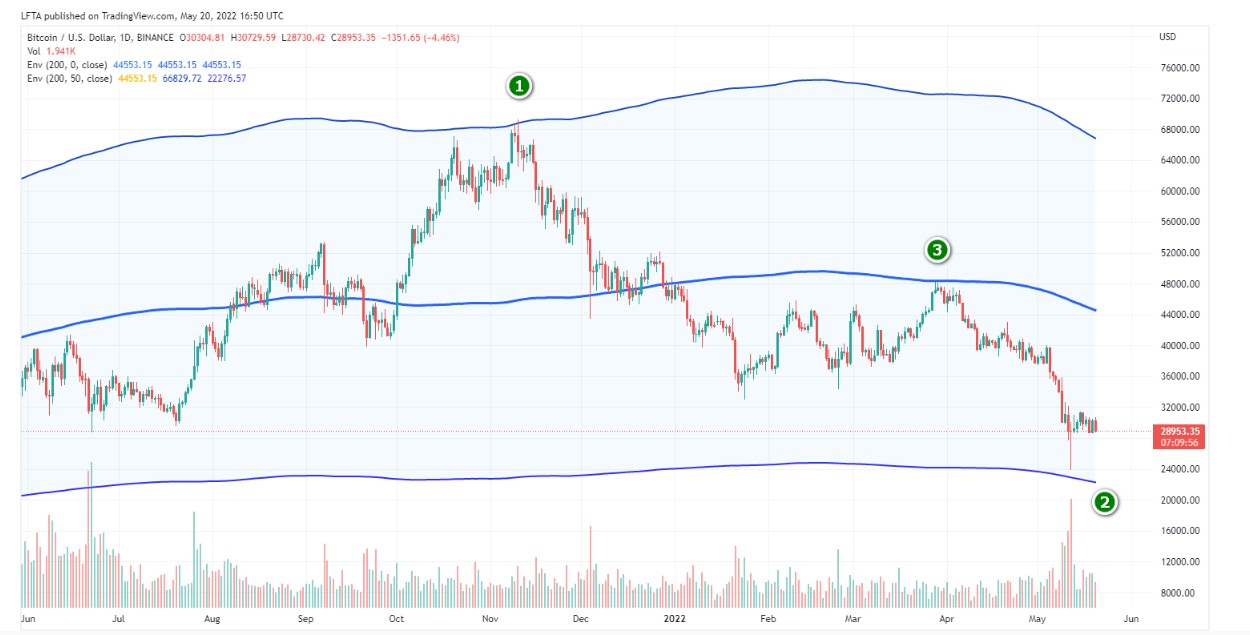
I tried to find an envelope like this that worked before – at point 1 we have a touch of it and then a strong down move. I expect that something similar to point 1 may occur at the touch at the point 2.
The average that is used to plot the envelope is again 200. In point 3 we see how it recently acted as resistance for a downward bounce.
Here we are dealing with the area around the 22,000 level.
- Strong Support Zone 3: Strong support at 20 000.
This is probably traders’ most familiar tool – support and resistance levels.
In the 20,000 zone we have two strong elements at the same time.
We have previous peaks (a typical support level) and the “four zeros” level – a typical place where many traders enter and exit the markets.
Levels with “round numbers” (like 10, 20, 30 thousand) are psychological levels for many traders. Again, we can expect a strong reaction now.
- The interest of the largest investors in BTC has grown strongly since last year.
One of the most important investor groups (perhaps even the most important from our point of view) is very interested in crypto investments. This group could bring potentially tens of additional billions of dollars to the markets.
Among the largest investors, we have three major groups. Banks, hedge funds and family offices. Family offices (the private investment funds of the wealthiest families) manage much more money than hedge funds (they have about 4.5 trillion dollars under management), while Family Offices have about 6 trillion.
Interest among the latter group of investors has increased significantly since last year. According to the study:
(from Barrons: „Future Returns: Cryptocurrency’s Future in Family Office Portfolios”)
“In February, BNY Mellon, in conjunction with the Harris Poll, released its first-ever global family office survey findings. Some of the most interesting data suggest a previously unheard of level of interest in cryptocurrency investments.
Of 200 key global family office personnel surveyed, 77% said their firms were exploring or investing in cryptocurrencies, with one out of five describing themselves as active investors.”
Summary:
We have 10 different arguments for a trend reversal on BTC in the 20,000 – 22,500 area.
Alternative viewpoint.
It is very often the case that the best analysis, based on the best indicators simply does not work. The analyst does not take into account one or more factors and the effect is completely different from expected. This can also be the case here.
To partially offset this effect, we use a fairly modern approach – we look at the market through the eyes of different groups of large investors. Each of these groups uses different tools. Averages, envelopes, Elliott Waves, support and resistance.
When many different pictures come together – we have better probability of the reversal.
If several large players start buying Bitcoin in roughly the same area then the probability of an upward move increases.
It is still a probability, not a certainty, which we never have.
An important disclaimer (or even two).
Dr. Dariusz Swierk is not investment advisor. The views presented are not advice to buy or sell any financial instruments and are for educational purposes only.
Dr. Dariusz Swierk does not currently hold any investments in BTC or its derivatives and does not plan to do so for at least 3 weeks.
We will follow the behavior of BTC, it will get even more interesting when the market bounces somewhere on the bottom and starts moving up.
About author:Dr. Dariusz Swierk is editor-in-chief of the London-based magazine for professional traders New City Trader. NCT: modern trading, new psychology, artificial intelligence, alternative data, new trends in trading, trading billionaires, cryptocurrencies. The current issue is free: www.NewCityTrader.com


 Review")


